Red Lobster 2012 Annual Report Download - page 57
Download and view the complete annual report
Please find page 57 of the 2012 Red Lobster annual report below. You can navigate through the pages in the report by either clicking on the pages listed below, or by using the keyword search tool below to find specific information within the annual report.-
 1
1 -
2
-
3
-
4
-
5
-
6
-
7
-
8
-
9
-
10
-
11
-
12
-
13
-
14
-
15
-
16
-
17
-
18
-
19
-
20
-
21
-
22
-
23
-
24
-
25
-
26
-
27
-
28
-
29
-
30
-
31
-
32
-
33
-
34
-
35
-
36
-
37
-
38
-
39
-
40
-
41
-
42
-
43
-
44
-
45
-
46
-
 47
47 -
 48
48 -
 49
49 -
 50
50 -
 51
51 -
 52
52 -
 53
53 -
 54
54 -
 55
55 -
 56
56 -
 57
57 -
 58
58 -
 59
59 -
 60
60 -
 61
61 -
 62
62 -
 63
63 -
 64
64 -
 65
65 -
 66
66 -
 67
67 -
68
-
69
-
70
-
71
-
72
-
73
-
74
 |
 |

Notes to Consolidated Financial Statements
Darden
Darden Restaurants, Inc. 2012 Annual Report 53
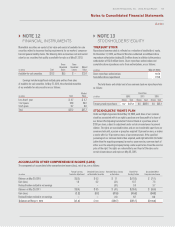
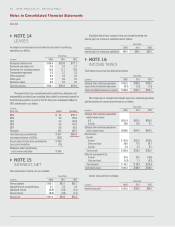
`NOTE 12
FINANCIAL INSTRUMENTS
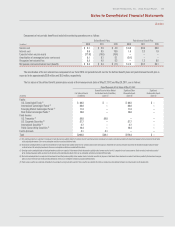
Marketable securities are carried at fair value and consist of available-for-sale
securities related to insurance funding requirements for our workers’ compensa-
tion and general liability claims. The following table summarizes cost and market
value for our securities that qualify as available-for-sale as of May 27, 2012:
Gross Gross
Unrealized Unrealized Market
(in millions)
Cost Gains Losses Value
Available-for-sale securities $37.2 $0.5 $ — $37.7
Earnings include insignificant realized gains and loss from sales
of available-for-sale securities. At May 27, 2012, the scheduled maturities
of our available-for-sale securities are as follows:
Market
(in millions)
Cost Value
Less than 1 year $ 4.7 $ 4.7
1 to 3 years 22.8 23.2
3 to 5 years 9.7 9.8
Total $37.2 $37.7
`NOTE 13
STOCKHOLDERS’ EQUITY
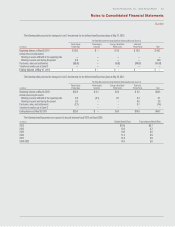
TREASURY STOCK
Repurchased common stock is reflected as a reduction of stockholders’ equity.
On December 17, 2010, our Board of Directors authorized an additional share
repurchase authorization totaling 25.0 million shares in addition to the previous
authorization of 162.4 million shares. Share repurchase authorizations and
cumulative share repurchases under these authorizations, are as follows:
(in millions)
May 27, 2012
Share repurchase authorizations 187.4
Cumulative shares repurchased 170.9
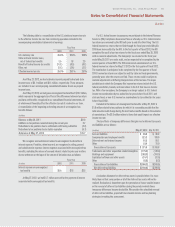
The total shares and related cost of our common stock we repurchased was
as follows:
Fiscal Year
(in millions)
2012 2011 2010
Shares Cost Shares Cost Shares Cost
Treasury stock repurchases 8.2 $375.1 8.6 $385.5 2.0 $85.1
STOCKHOLDERS’ RIGHTS PLAN
Under our Rights Agreement dated May 16, 2005, each share of our common
stock has associated with it one right to purchase one thousandth of a share of
our Series A Participating Cumulative Preferred Stock at a purchase price of
$120 per share, subject to adjustment under certain circumstances to prevent
dilution. The rights are exercisable when, and are not transferable apart from our
common stock until, a person or group has acquired 15 percent or more, or makes
a tender offer for 15 percent or more, of our common stock. If the specified
percentage of our common stock is then acquired, each right will entitle the holder
(other than the acquiring company) to receive, upon exercise, common stock of
either us or the acquiring company having a value equal to two times the exercise
price of the right. The rights are redeemable by our Board of Directors under
certain circumstances and expire on May 25, 2015.
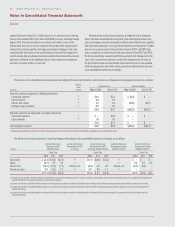
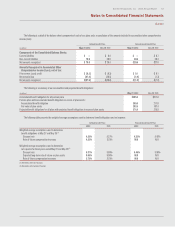
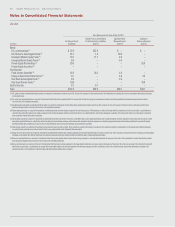
ACCUMULATED OTHER COMPREHENSIVE INCOME (LOSS)
The components of accumulated other comprehensive income (loss), net of tax, are as follows:
Foreign Currency Unrealized Gains (Losses) Unrealized Gains (Losses) Benefit Plan Accumulated Other
(in millions)
Translation Adjustment on Marketable Securities on Derivatives Funding Position Comprehensive Income
Balances at May 30, 2010 $(2.2) $ 0.3 $ 1.1 $(70.3) $ (71.1)
Gain (loss) 1.8 0.2 (5.1) 10.7 7.6
Reclassification realized in net earnings — — (0.1) 3.8 3.7
Balances at May 29, 2011 $(0.4) $ 0.5 $ (4.1) $(55.8) $ (59.8)
Gain (loss) (1.2) (0.1) (47.9) (45.6) (94.8)
Reclassification realized in net earnings — — 2.3 5.7 8.0
Balances at May 27, 2012 $(1.6) $ 0.4 $(49.7) $(95.7) $(146.6)