Red Lobster 2012 Annual Report Download - page 2
Download and view the complete annual report
Please find page 2 of the 2012 Red Lobster annual report below. You can navigate through the pages in the report by either clicking on the pages listed below, or by using the keyword search tool below to find specific information within the annual report.-
 1
1 -
 2
2 -
 3
3 -
 4
4 -
 5
5 -
 6
6 -
 7
7 -
 8
8 -
 9
9 -
 10
10 -
 11
11 -
 12
12 -
 13
13 -
14
-
15
-
16
-
17
-
18
-
19
-
20
-
21
-
22
-
23
-
24
-
25
-
26
-
27
-
28
-
29
-
30
-
31
-
32
-
33
-
34
-
35
-
36
-
37
-
38
-
39
-
40
-
41
-
42
-
43
-
44
-
45
-
46
-
47
-
48
-
49
-
50
-
51
-
52
-
53
-
54
-
55
-
56
-
57
-
58
-
59
-
60
-
61
-
62
-
63
-
64
-
65
-
66
-
67
-
68
-
69
-
70
-
71
-
72
-
73
-
74
 |
 |

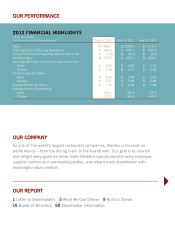
2012 FINANCIAL HIGHLIGHTS
Fiscal Year Ended
(In Millions, Except Per Share Amounts) May 27, 2012 May 29, 2011 May 30, 2010
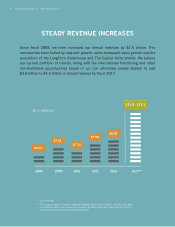
Sales $ 7,998.7 $ 7,500.2 $ 7,113.1
Earnings from Continuing Operations $ 476.5 $ 478.7 $ 407.0
Losses from Discontinued Operations, net of tax $ (1.0) $ (2.4) $ (2.5)
Net Earnings $ 475.5 $ 476.3 $ 404.5
Earnings per Share from Continuing Operations:
Basic $ 3.66 $ 3.50 $ 2.92
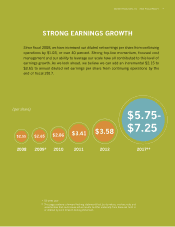
Diluted $ 3.58 $ 3.41 $ 2.86
Net Earnings per Share:
Basic $ 3.65 $ 3.48 $ 2.90
Diluted $ 3.57 $ 3.39 $ 2.84
Dividends Paid per Share $ 1.72 $ 1.28 $ 1.00
Average Shares Outstanding:
Basic 130.1 136.8 139.3
Diluted 133.2 140.3 142.4
OUR PERFORMANCE
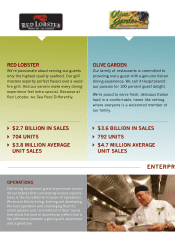
OUR COMPANY
As one of the world’s largest restaurant companies, Darden is focused on
performance – from the dining room to the boardroom. Our goal is to nourish
and delight every guest we serve, make Darden a special place for every employee,
supplier partner and community partner, and reward every shareholder with
meaningful value creation.
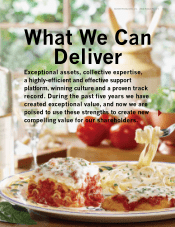
1 Letter to Shareholders 5 What We Can Deliver 9 Built to Deliver
16 Board of Directors 68 Shareholder Information
OUR REPORT