Red Lobster 2012 Annual Report Download - page 61
Download and view the complete annual report
Please find page 61 of the 2012 Red Lobster annual report below. You can navigate through the pages in the report by either clicking on the pages listed below, or by using the keyword search tool below to find specific information within the annual report.-
 1
1 -
2
-
3
-
4
-
5
-
6
-
7
-
8
-
9
-
10
-
11
-
12
-
13
-
14
-
15
-
16
-
17
-
18
-
19
-
20
-
21
-
22
-
23
-
24
-
25
-
26
-
27
-
28
-
29
-
30
-
31
-
32
-
33
-
34
-
35
-
36
-
37
-
38
-
39
-
40
-
41
-
42
-
43
-
44
-
45
-
46
-
47
-
48
-
49
-
50
-
 51
51 -
 52
52 -
 53
53 -
 54
54 -
 55
55 -
 56
56 -
 57
57 -
 58
58 -
 59
59 -
 60
60 -
 61
61 -
 62
62 -
 63
63 -
 64
64 -
 65
65 -
 66
66 -
 67
67 -
 68
68 -
 69
69 -
 70
70 -
 71
71 -
72
-
73
-
74
 |
 |

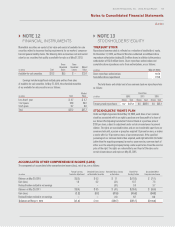
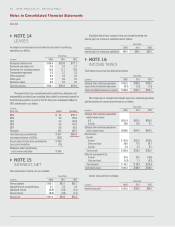
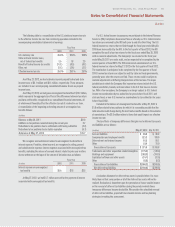
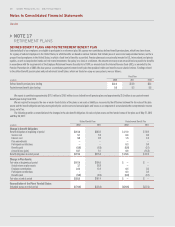
Notes to Consolidated Financial Statements
Darden
Darden Restaurants, Inc. 2012 Annual Report 57
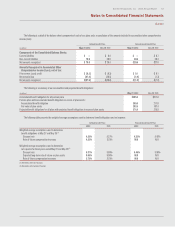
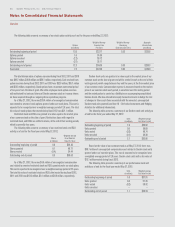
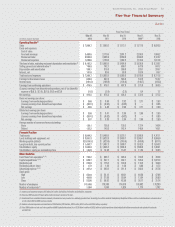
The following is a detail of the balance sheet components of each of our plans and a reconciliation of the amounts included in accumulated other comprehensive
income (loss):
Defined Benefit Plans Postretirement Benefit Plan
(in millions)
May 27, 2012 May 29, 2011 May 27, 2012 May 29, 2011
Components of the Consolidated Balance Sheets:
Current liabilities $ — $ 0.4 $ — $ 0.7
Non-current liabilities 70.9 28.0 29.6 26.3
Net amounts recognized $ 70.9 $ 28.4 $29.6 $27.0
Amounts Recognized in Accumulated Other
Comprehensive Income (Loss), net of tax:
Prior service (cost) credit $ (0.2) $ (0.3) $ 0.1 $ 0.1
Net actuarial loss (87.4) (50.5) (1.9) (1.3)
Net amounts recognized $(87.6) $(50.8) $ (1.8) $(1.2)
The following is a summary of our accumulated and projected benefit obligations:
(in millions)
May 27, 2012 May 29, 2011
Accumulated benefit obligation for all pension plans $265.0 $211.8
Pension plans with accumulated benefit obligations in excess of plan assets:
Accumulated benefit obligation 265.0 211.8
Fair value of plan assets 203.5 187.4
Projected benefit obligations for all plans with projected benefit obligations in excess of plan assets 274.4 215.8
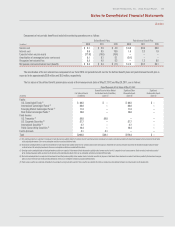
The following table presents the weighted-average assumptions used to determine benefit obligations and net expense:
Defined Benefit Plans Postretirement Benefit Plan
2012 2011 2012 2011
Weighted-average assumptions used to determine
benefit obligations at May 27 and May 29 (1)
Discount rate 4.35% 5.37% 4.52% 5.46%
Rate of future compensation increases 4.22% 3.75% N/A N/A
Weighted-average assumptions used to determine
net expense for fiscal years ended May 27 and May 29 (2)
Discount rate 5.37% 5.89% 5.46% 5.98%
Expected long-term rate of return on plan assets 9.00% 9.00% N/A N/A
Rate of future compensation increases 3.75% 3.75% N/A N/A
(1) Determined as of the end of fiscal year.
(2) Determined as of the beginning of fiscal year.