Red Lobster 2012 Annual Report Download - page 11
Download and view the complete annual report
Please find page 11 of the 2012 Red Lobster annual report below. You can navigate through the pages in the report by either clicking on the pages listed below, or by using the keyword search tool below to find specific information within the annual report.-
 1
1 -
 2
2 -
 3
3 -
 4
4 -
 5
5 -
 6
6 -
 7
7 -
 8
8 -
 9
9 -
 10
10 -
 11
11 -
 12
12 -
 13
13 -
 14
14 -
 15
15 -
 16
16 -
 17
17 -
 18
18 -
 19
19 -
 20
20 -
 21
21 -
 22
22 -
23
-
24
-
25
-
26
-
27
-
28
-
29
-
30
-
31
-
32
-
33
-
34
-
35
-
36
-
37
-
38
-
39
-
40
-
41
-
42
-
43
-
44
-
45
-
46
-
47
-
48
-
49
-
50
-
51
-
52
-
53
-
54
-
55
-
56
-
57
-
58
-
59
-
60
-
61
-
62
-
63
-
64
-
65
-
66
-
67
-
68
-
69
-
70
-
71
-
72
-
73
-
74
 |
 |

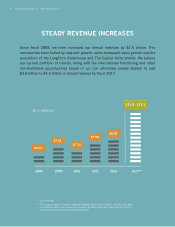
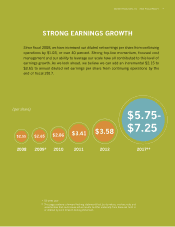
STRONG EARNINGS GROWTH
Since fiscal 2008, we have increased our diluted net earnings per share from continuing
operations by $1.03, or over 40 percent. Strong top-line momentum, focused cost
management and our ability to leverage our scale have all contributed to this level of
earnings growth. As we look ahead, we believe we can add an incremental $2.15 to
$3.65 to annual diluted net earnings per share from continuing operations by the
end of fiscal 2017.
2008 2017**
$3.58
$5.75-
$7.25
(per share)
$2.86
$2.65
$2.55 $3.41
2009* 2010 2011 2012
* 53-week year
** This page contains a forward-looking statement that, by its nature, involves risks and
uncertainties that could cause actual results to differ materially from those set forth in
or implied by such forward-looking statement.
Darden Restaurants, Inc. 2012 Annual Report 7