Red Lobster 2012 Annual Report Download - page 32
Download and view the complete annual report
Please find page 32 of the 2012 Red Lobster annual report below. You can navigate through the pages in the report by either clicking on the pages listed below, or by using the keyword search tool below to find specific information within the annual report.-
 1
1 -
2
-
3
-
4
-
5
-
6
-
7
-
8
-
9
-
10
-
11
-
12
-
13
-
14
-
15
-
16
-
17
-
18
-
19
-
20
-
21
-
 22
22 -
 23
23 -
 24
24 -
 25
25 -
 26
26 -
 27
27 -
 28
28 -
 29
29 -
 30
30 -
 31
31 -
 32
32 -
 33
33 -
 34
34 -
 35
35 -
 36
36 -
 37
37 -
 38
38 -
 39
39 -
 40
40 -
 41
41 -
 42
42 -
43
-
44
-
45
-
46
-
47
-
48
-
49
-
50
-
51
-
52
-
53
-
54
-
55
-
56
-
57
-
58
-
59
-
60
-
61
-
62
-
63
-
64
-
65
-
66
-
67
-
68
-
69
-
70
-
71
-
72
-
73
-
74
 |
 |
Management’s Discussion and Analysis
of Financial Condition and Results of Operations
Darden
28 Darden Restaurants, Inc. 2012 Annual Report
Our fixed-charge coverage ratio, which measures the number of times each
year that we earn enough to cover our fixed charges, amounted to 5.0 times and
5.4 times, on a continuing operations basis, for the fiscal years ended May 27,
2012 and May 29, 2011, respectively. Our adjusted debt to adjusted total capital
ratio (which includes 6.25 times the total annual minimum rent of $136.6 million
and $125.6 million for the fiscal years ended May 27, 2012 and May 29, 2011,
respectively, as components of adjusted debt and adjusted total capital) was
62 percent and 56 percent at May 27, 2012 and May 29, 2011, respectively.
We include the lease-debt equivalent and contractual lease guarantees in our
adjusted debt to adjusted total capital ratio reported to shareholders, as we
believe its inclusion better represents the optimal capital structure that we
target from period to period and because it is consistent with the calculation
of the covenant under our New Revolving Credit Agreement.
Based on these ratios, we believe our financial condition is strong.
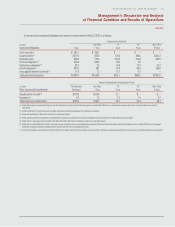
The composition of our capital structure is shown in the following table.
May 27, May 29,
(in millions, except ratios)
2012 2011
CAPITAL STRUCTURE
Short-term debt $ 262.7 $ 185.5
Current portion long-term debt 350.0 —
Long-term debt, excluding unamortized discounts 1,459.1 1,411.7
Capital lease obligations 56.0 57.3
Total debt $2,127.8 $1,654.5
Stockholders’ equity 1,842.0 1,936.2
Total capital $3,969.8 $3,590.7
CALCULATION OF ADJUSTED CAPITAL
Total debt $2,127.8 $1,654.5
Lease-debt equivalent 853.8 785.0
Guarantees 5.4 7.4
Adjusted debt $2,987.0 $2,446.9
Stockholders’ equity 1,842.0 1,936.2
Adjusted total capital $4,829.0 $4,383.1
CAPITAL STRUCTURE RATIOS
Debt to total capital ratio 54% 46%
Adjusted debt to adjusted total capital ratio 62% 56%
Net cash flows provided by operating activities from continuing operations
were $762.2 million, $894.7 million and $903.4 million in fiscal 2012, 2011
and 2010, from continuing operations of $476.5 million, $478.7 million and
$407.0 million in fiscal 2012, 2011 and 2010, respectively. Net cash flows
provided by operating activities from continuing operations decreased in fiscal
2012 primarily due to higher inventory levels and the settlement of our October
2011 treasury-lock instruments. The increase in inventory levels in fiscal 2012
was primarily related to the timing of inventory purchases as a result of our
strategy to take ownership of our inventory earlier in the supply chain to ensure a
more secure and efficient supply of inventory to our restaurants. Net cash flows
provided by operating activities reflect income tax payments of $123.5 million,
$126.4 million and $94.8 million in fiscal 2012, 2011 and 2010, respectively. The
lower tax payments in fiscal 2010, as compared with tax payments in fiscal 2012
and 2011, primarily relates to the recognition of tax benefits related to the
timing of deductions for fixed-asset related expenditures and the application
of the overpayment of income taxes in prior years to fiscal 2010 tax liabilities.
Net cash flows used in investing activities from continuing operations were
$721.6 million, $552.7 million and $428.7 million in fiscal 2012, 2011 and 2010,
respectively. Net cash flows used in investing activities from continuing operations
included capital expenditures incurred principally for building new restaurants,
remodeling existing restaurants, replacing equipment, and technology initiatives.
Capital expenditures related to continuing operations were $639.7 million in fiscal
2012, compared to $547.7 million in fiscal 2011 and $432.1 million in fiscal 2010.
The increasing trend of expenditures in fiscal 2012 and 2011 results primarily
from increases in remodel and new restaurant activity over the past two years.
Additionally, net cash used in the acquisition of Eddie V’s in fiscal 2012 was
$58.5 million.
Net cash flows used in financing activities from continuing operations were
$40.4 million, $521.0 million and $290.0 million in fiscal 2012, 2011 and 2010,
respectively. During October 2011, we completed the offering of $400.0 million
of New Senior Notes, resulting in net proceeds of $394.9 million which were used
to effectively refinance the $225.0 million of long-term notes that we repaid at
maturity during fiscal 2011 and a portion of our outstanding short-term debt.
Repayments of long-term debt were $2.1 million, $226.8 million and $1.8 million
in fiscal 2012, 2011 and 2010, respectively. Net proceeds from the issuance of
short-term debt were $77.2 million and $185.5 million in fiscal 2012 and 2011,
respectively, while net repayments of short-term debt were $150.0 million in
fiscal 2010. For fiscal 2012, net cash flows used in financing activities included
our repurchase of 8.2 million shares of our common stock for $375.1 million,
compared to 8.6 million shares of our common stock for $385.5 million in fiscal
2011 and 2.0 million shares of our common stock for $85.1 million in fiscal 2010.
As of May 27, 2012, our Board of Directors had authorized us to repurchase up to
187.4 million shares of our common stock and a total of 170.9 million shares had
been repurchased under the authorization. The repurchased common stock is
reflected as a reduction of stockholders’ equity. As of May 27, 2012, our unused
authorization was 16.5 million shares. We received proceeds primarily from the
issuance of common stock upon the exercise of stock options of $70.2 million,
$63.0 million and $66.3 million in fiscal 2012, 2011 and 2010, respectively. Net
cash flows used in financing activities also included dividends paid to stock-
holders of $223.9 million, $175.5 million and $140.0 million in fiscal 2012, 2011
and 2010, respectively. The increase in dividend payments reflects the increase
in our annual dividend rate from $1.00 per share in fiscal 2010, to $1.28 per
share in fiscal 2011 and to $1.72 per share in fiscal 2012. In June 2012, our
Board of Directors approved an increase in the quarterly dividend to $0.50 per
share, which indicates an annual dividend of $2.00 per share in fiscal 2013.
Our defined benefit and other postretirement benefit costs and liabilities are
determined using various actuarial assumptions and methodologies prescribed
underFASBASCTopic715,Compensation–RetirementBenefitsandTopic712,
Compensation–NonretirementPostemploymentBenefits.Weusecertain
assumptions including, but not limited to, the selection of a discount rate,
expected long-term rate of return on plan assets and expected health care cost
trend rates. We set the discount rate assumption annually for each plan at its
valuation date to reflect the yield of high-quality fixed-income debt instruments,