Red Lobster 2012 Annual Report Download - page 33
Download and view the complete annual report
Please find page 33 of the 2012 Red Lobster annual report below. You can navigate through the pages in the report by either clicking on the pages listed below, or by using the keyword search tool below to find specific information within the annual report.-
 1
1 -
2
-
3
-
4
-
5
-
6
-
7
-
8
-
9
-
10
-
11
-
12
-
13
-
14
-
15
-
16
-
17
-
18
-
19
-
20
-
21
-
22
-
 23
23 -
 24
24 -
 25
25 -
 26
26 -
 27
27 -
 28
28 -
 29
29 -
 30
30 -
 31
31 -
 32
32 -
 33
33 -
 34
34 -
 35
35 -
 36
36 -
 37
37 -
 38
38 -
 39
39 -
 40
40 -
 41
41 -
 42
42 -
 43
43 -
44
-
45
-
46
-
47
-
48
-
49
-
50
-
51
-
52
-
53
-
54
-
55
-
56
-
57
-
58
-
59
-
60
-
61
-
62
-
63
-
64
-
65
-
66
-
67
-
68
-
69
-
70
-
71
-
72
-
73
-
74
 |
 |

Management’s Discussion and Analysis
of Financial Condition and Results of Operations
Darden
Darden Restaurants, Inc. 2012 Annual Report 29
with lives that approximate the maturity of the plan benefits. At May 27, 2012,
our discount rate was 4.4 percent and 4.5 percent, respectively, for our defined
benefit and postretirement benefit plans. The expected long-term rate of return
on plan assets and health care cost trend rates are based upon several factors,
including our historical assumptions compared with actual results, an analysis of
current market conditions, asset allocations and the views of leading financial
advisers and economists. Our assumed expected long-term rate of return on plan
assets for our defined benefit plan was 9.0 percent for each of the fiscal years
reported. At May 27, 2012, the expected health care cost trend rate assumed
for our postretirement benefit plan for fiscal 2013 was 7.7 percent. The rate
gradually decreases to 5.0 percent through fiscal 2022 and remains at that level
thereafter. We made contributions of approximately $22.2 million, $12.9 million
and $0.4 million in fiscal years 2012, 2011 and 2010, respectively, to our defined
benefit pension plan to maintain its targeted funded status as of each annual
valuation date.
The expected long-term rate of return on plan assets component of our
net periodic benefit cost is calculated based on the market-related value of plan
assets. Our target asset fund allocation is 40 percent U.S. equities, 35 percent
high-quality, long-duration fixed-income securities, 20 percent international
equities, 5 percent real estate securities. We monitor our actual asset fund
allocation to ensure that it approximates our target allocation and believe that
our long-term asset fund allocation will continue to approximate our target
allocation. In developing our expected rate of return assumption, we have
evaluated the actual historical performance and long-term return projections of
the plan assets, which give consideration to the asset mix and the anticipated
timing of the pension plan outflows. We employ a total return investment
approach whereby a mix of equity and fixed-income investments are used to
maximize the long-term return of plan assets for what we consider a prudent
level of risk. Our historical 10-year, 15-year and 20-year rates of return on
plan assets, calculated using the geometric method average of returns,
are approximately 7.8 percent, 8.0 percent and 9.4 percent, respectively,
as of May 27, 2012.
We have recognized net actuarial losses, net of tax, as a component of
accumulated other comprehensive income (loss) for the defined benefit plans and
postretirement benefit plan as of May 27, 2012 of $87.4 million and $1.9 million,
respectively. These net actuarial losses represent changes in the amount of the
projected benefit obligation and plan assets resulting from differences in the
assumptions used and actual experience. The amortization of the net actuarial
loss component of our fiscal 2013 net periodic benefit cost for the defined
benefit plans and postretirement benefit plan is expected to be approximately
$8.8 million and $0.0 million, respectively.
We believe our defined benefit and postretirement benefit plan assumptions
are appropriate based upon the factors discussed above. However, other assump-
tions could also be reasonably applied that could differ from the assumptions
used. A quarter-percentage point change in the defined benefit plans’ discount
rate and the expected long-term rate of return on plan assets would increase
or decrease earnings before income taxes by $0.7 million and $0.5 million,
respectively. A quarter-percentage point change in our postretirement benefit
plan discount rate would increase or decrease earnings before income taxes by
$0.1 million. A one-percentage point increase in the health care cost trend rates
would increase the accumulated postretirement benefit obligation (APBO) by
$6.5 million at May 27, 2012 and the aggregate of the service cost and interest
cost components of net periodic postretirement benefit cost by
$0.5 million for fiscal 2012. A one-percentage point decrease in the health care
cost trend rates would decrease the APBO by $5.1 million at May 27, 2012 and
the aggregate of the service cost and interest cost components of net periodic
postretirement benefit cost by $0.4 million for fiscal 2012. These changes in
assumptions would not significantly impact our funding requirements. We expect
to contribute approximately $17.5 million to $19.5 million to our defined benefit
pension plans and approximately $1.0 million to our postretirement benefit plan
during fiscal 2013.
On July 12, 2012, we entered into an agreement to acquire Yard House
for $585.0 million in an all-cash transaction. After the acquisition, Yard House
will be a wholly-owned subsidiary of Darden. The transaction has been approved
by our Board of Directors and is subject to the satisfaction of customary closing
conditions, including, among others, the expiration or termination of the applicable
waiting periods under the Hart-Scott-Rodino Antitrust Improvements Act of
1976. The acquisition is expected to be completed early in the second quarter
of fiscal 2013.
With the exception of the pending Yard House acquisition discussed above,
we are not aware of any trends or events that would materially affect our capital
requirements or liquidity. We believe that our internal cash-generating capabilities,
the potential issuance of unsecured debt securities under our shelf registration
statement and short-term commercial paper should be sufficient to finance our
capital expenditures, including the Yard House acquisition, debt maturities, stock
repurchase program and other operating activities through fiscal 2013.
OFF-BALANCE SHEET ARRANGEMENTS
We are not a party to any off-balance sheet arrangements that have, or are
reasonably likely to have, a current or future material effect on our financial
condition, changes in financial condition, sales or expenses, results of operations,
liquidity, capital expenditures or capital resources.
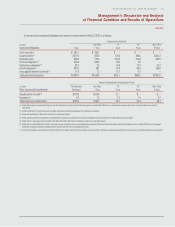
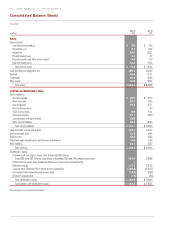
FINANCIAL CONDITION
Our total current assets were $757.6 million at May 27, 2012, compared
with $663.8 million at May 29, 2011. The increase was primarily due to higher
inventory levels related to the timing of inventory purchases as a result of our
strategy to take ownership of our inventory earlier in the supply chain to ensure
a more secure and efficient supply of inventory to our restaurants.
Our total current liabilities were $1.77 billion at May 27, 2012, compared
with $1.29 billion at May 29, 2011. The increase was primarily due to an increase
in short-term debt related to our use of short-term financing to repurchase
shares of our common stock, capital expenditures, purchase of inventory and the
reclassification of long-term debt maturing within the next year.