Red Lobster 2012 Annual Report Download - page 56
Download and view the complete annual report
Please find page 56 of the 2012 Red Lobster annual report below. You can navigate through the pages in the report by either clicking on the pages listed below, or by using the keyword search tool below to find specific information within the annual report.-
 1
1 -
2
-
3
-
4
-
5
-
6
-
7
-
8
-
9
-
10
-
11
-
12
-
13
-
14
-
15
-
16
-
17
-
18
-
19
-
20
-
21
-
22
-
23
-
24
-
25
-
26
-
27
-
28
-
29
-
30
-
31
-
32
-
33
-
34
-
35
-
36
-
37
-
38
-
39
-
40
-
41
-
42
-
43
-
44
-
45
-
 46
46 -
 47
47 -
 48
48 -
 49
49 -
 50
50 -
 51
51 -
 52
52 -
 53
53 -
 54
54 -
 55
55 -
 56
56 -
 57
57 -
 58
58 -
 59
59 -
 60
60 -
 61
61 -
 62
62 -
 63
63 -
 64
64 -
 65
65 -
 66
66 -
67
-
68
-
69
-
70
-
71
-
72
-
73
-
74
 |
 |

Notes to Consolidated Financial Statements
Darden
52 Darden Restaurants, Inc. 2012 Annual Report
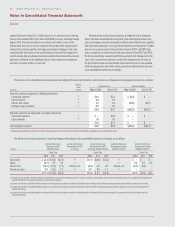
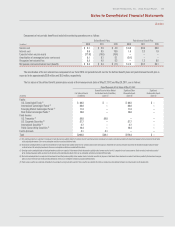
Items Measured at Fair Value at May 29, 2011
Quoted Prices in Active Market Significant Other Significant
Fair Value of Assets for Identical Assets (Liabilities) Observable Inputs Unobservable Inputs
(in millions) (Liabilities) (Level 1) (Level 2) (Level 3)
Fixed-income securities:
Corporate bonds (1) $ 16.6 $ — $ 16.6 $ —
U.S. Treasury securities (2) 10.6 10.6 — —
Mortgage-backed securities (1) 4.9 — 4.9 —
Derivatives:
Commodities futures, swaps & options (3) 0.7 — 0.7 —
Equity forwards (4) 0.9 — 0.9 —
Interest rate locks & swaps (5) (19.6) — (19.6) —
Foreign currency forwards (6) 0.6 — 0.6 —
Total $ 14.7 $10.6 $ 4.1 $ —
(1) The fair value of these securities is based on the closing market prices of the investments when applicable, or, alternatively, valuations utilizing market data and other observable inputs, inclusive of the risk of nonperformance.
(2) The fair value of our U.S. Treasury securities is based on the closing market prices.
(3) The fair value of our commodities futures, swaps and options is based on closing market prices of the contracts, inclusive of the risk of nonperformance.
(4) The fair value of our equity forwards is based on the closing market value of Darden stock, inclusive of the risk of nonperformance.
(5) The fair value of our interest rate lock and swap agreements is based on current and expected market interest rates, inclusive of the risk of nonperformance.
(6) The fair value of our foreign currency forward contracts is based on the closing forward exchange market prices, inclusive of the risk of nonperformance.
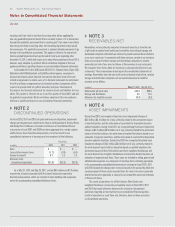
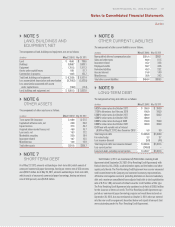
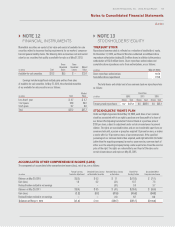
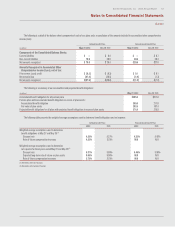
The carrying value and fair value of long-term debt, including the amounts included in current liabilities, as of May 27, 2012, was $1.80 billion and $1.99 billion,
respectively. The carrying value and fair value of long-term debt as of May 29, 2011, was $1.41 billion and $1.56 billion, respectively. The fair value of long-term debt is
determined based on market prices or, if market prices are not available, the present value of the underlying cash flows discounted at our incremental borrowing rates.
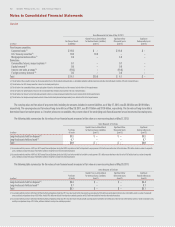
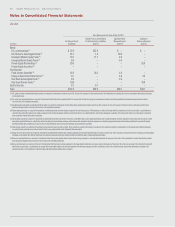
The following table summarizes the fair values of non-financial assets measured at fair value on a non-recurring basis at May 27, 2012:
Items Measured at Fair Value
Quoted Prices in Active Market Significant Other Significant
Fair Value for Identical Assets (Liabilities) Observable Inputs Unobservable Inputs
(in millions) of Assets (Level 1) (Level 2) (Level 3)
Long-lived assets held for disposal (1) $3.2 $ — $ — $3.2
Long-lived assets held and used (2) 0.7 — — 0.7
Total $3.9 $ — $ — $3.9
(1) In accordance with the provisions of ASC Topic 360, Property, Plant and Equipment, during fiscal 2012, long-lived assets held for disposal with a carrying amount of $3.5 million were written down to their fair value of $3.2 million, based on a review of comparable
assets, resulting in an impairment charge of $0.3 million, which was included in losses from discontinued operations.
(2) In accordance with the provisions of ASC Topic 360, Property, Plant and Equipment, during fiscal 2012, long-lived assets held and used with a carrying amount of $1.1 million were written down to their fair value of $0.7 million, based on a review of comparable
assets, resulting in an impairment charge of $0.4 million, which was included in earnings from continuing operations.
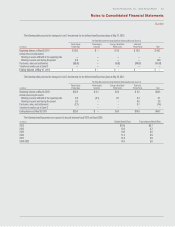
The following table summarizes the fair values of non-financial assets measured at fair value on a non-recurring basis at May 29, 2011:
Items Measured at Fair Value
Quoted Prices in Active Market Significant Other Significant
Fair Value for Identical Assets (Liabilities) Observable Inputs Unobservable Inputs
(in millions) of Assets (Level 1) (Level 2) (Level 3)
Long-lived assets held for disposal (1) $4.4 $ — $ — $4.4
Long-lived assets held and used (2) 0.7 — — 0.7
Total $5.1 $ — $ — $5.1
(1) In accordance with the provisions of ASC Topic 360, Property, Plant and Equipment, during fiscal 2011, long-lived assets held for disposal with a carrying amount of $7.0 million were written down to their fair value of $4.4 million, based on a review of comparable
assets, resulting in an impairment charge of $2.6 million, of which $1.9 million was included in earnings from continuing operations and $0.7 million was included in losses from discontinued operations.
(2) In accordance with the provisions of ASC Topic 360, Property, Plant and Equipment, during fiscal 2011, long-lived assets held and used with a carrying amount of $2.8 million were written down to their fair value of $0.7 million, based on a review of comparable assets,
resulting in an impairment charge of $2.1 million, which was included in earnings from continuing operations.