Red Lobster 2012 Annual Report Download - page 25
Download and view the complete annual report
Please find page 25 of the 2012 Red Lobster annual report below. You can navigate through the pages in the report by either clicking on the pages listed below, or by using the keyword search tool below to find specific information within the annual report.-
 1
1 -
2
-
3
-
4
-
5
-
6
-
7
-
8
-
9
-
10
-
11
-
12
-
13
-
14
-
 15
15 -
 16
16 -
 17
17 -
 18
18 -
 19
19 -
 20
20 -
 21
21 -
 22
22 -
 23
23 -
 24
24 -
 25
25 -
 26
26 -
 27
27 -
 28
28 -
 29
29 -
 30
30 -
 31
31 -
 32
32 -
 33
33 -
 34
34 -
 35
35 -
36
-
37
-
38
-
39
-
40
-
41
-
42
-
43
-
44
-
45
-
46
-
47
-
48
-
49
-
50
-
51
-
52
-
53
-
54
-
55
-
56
-
57
-
58
-
59
-
60
-
61
-
62
-
63
-
64
-
65
-
66
-
67
-
68
-
69
-
70
-
71
-
72
-
73
-
74
 |
 |

Management’s Discussion and Analysis
of Financial Condition and Results of Operations
Darden
Darden Restaurants, Inc. 2012 Annual Report 21
higher media costs. As a percent of sales, selling, general and administrative
expenses increased from fiscal 2010 to fiscal 2011 primarily due to higher media
expenses and compensation expenses partially offset by sales leveraging.
Depreciation and amortization expense increased $32.3 million, or
10.2 percent, from $316.8 million in fiscal 2011 to $349.1 million in fiscal 2012.
Depreciation and amortization expense increased $15.9 million, or 5.3 percent,
from $300.9 million in fiscal 2010 to $316.8 million in fiscal 2011. As a percent of
sales, depreciation and amortization expense increased in fiscal 2012 primarily
due to an increase in depreciable assets related to new restaurants and remodel
activities, partially offset by sales leveraging. As a percent of sales, depreciation
and amortization expense decreased in fiscal 2011 primarily due to sales
leveraging, partially offset by the increase in depreciable assets related to new
restaurants and remodel activities.
Net interest expense increased $8.0 million, or 8.5 percent, from
$93.6 million in fiscal 2011 to $101.6 million in fiscal 2012. Net interest expense
decreased $0.3 million, or 0.3 percent, from $93.9 million in fiscal 2010 to
$93.6 million in fiscal 2011. As a percent of sales, net interest expense increased
in fiscal 2012 compared to fiscal 2011 due to higher average debt balances in
fiscal 2012, partially offset by sales leveraging. As a percent of sales, net interest
expense decreased in fiscal 2011 compared to fiscal 2010 primarily as a result of
lower average debt balances associated with the repayment of a portion of our
long-term debt and sales leveraging, partially offset by the fiscal 2010 release of
interest reserves associated with the favorable resolution of tax matters in
fiscal 2010.
INCOME TAXES
The effective income tax rates for fiscal 2012, 2011 and 2010 continuing
operations were 25.3 percent, 26.1 percent and 25.1 percent, respectively.
The decrease in our effective rate for fiscal 2012 is primarily attributable to
an increase in federal income tax credits related to the HIRE Act, an increase in
the impact of FICA tax credits for employee reported tips, partially offset by the
impact of market-driven changes in the value of our trust-owned life insurance
that are excluded for tax purposes. The increase in our effective rate for fiscal
2011 is primarily attributable to the impact in fiscal 2010 of the favorable
resolution of prior-year tax matters expensed in prior years and due to the
increase in earnings before income taxes in fiscal 2011, partially offset by the
impact of market-driven changes in the value of our trust-owned life insurance
that are excluded for tax purposes.
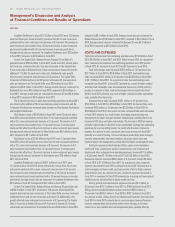
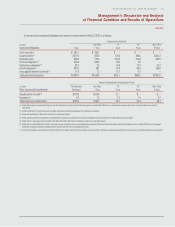
NET EARNINGS AND NET EARNINGS PER SHARE
FROM CONTINUING OPERATIONS
Net earnings from continuing operations for fiscal 2012 were $476.5 million
($3.58 per diluted share) compared with net earnings from continuing operations
for fiscal 2011 of $478.7 million ($3.41 per diluted share) and net earnings from
continuing operations for fiscal 2010 of $407.0 million ($2.86 per diluted share).
Net earnings from continuing operations for fiscal 2012 decreased
0.5 percent and diluted net earnings per share from continuing operations
increased 5.0 percent compared with fiscal 2011. The decrease in net earnings
from continuing operations was primarily due to higher food and beverage costs,
depreciation and amortization expense, and net interest expense as a percent of
sales, which were partially offset by increased sales and lower restaurant labor
expenses, restaurant expenses and selling, general and administrative expenses
as a percent of sales, and a lower effective income tax rate. While net earnings
from continuing operations decreased, diluted net earnings per share from
continuing operations increased for fiscal 2012 due to a reduction in the average
diluted shares outstanding primarily as a result of the cumulative impact of our
continuing repurchase of our common stock.
Net earnings from continuing operations for fiscal 2011 increased
17.6 percent and diluted net earnings per share from continuing operations
increased 19.2 percent compared with fiscal 2010. The increases in net earnings
and diluted net earnings per share from continuing operations were primarily
due to increases in sales and decreases in restaurant labor costs, restaurant
expenses, depreciation and amortization expenses and interest expenses as a
percent of sales, which were only partially offset by increases in food and
beverage costs and selling, general and administrative expenses as a percent
of sales. Diluted net earnings per share growth for fiscal 2011 was impacted by
the reduction of diluted net earnings per share in fiscal 2010 of approximately
$0.09 as a result of adjustments to our gift card redemption rate assumptions
based on current consumer redemption behavior. Diluted net earnings per share
from continuing operations for fiscal 2011 also benefited from the cumulative
impact of our share repurchase program.
LOSSES FROM DISCONTINUED OPERATIONS
On an after-tax basis, losses from discontinued operations for fiscal 2012 were
$1.0 million ($0.01 per diluted share) compared with losses from discontinued
operations for fiscal 2011 of $2.4 million ($0.02 per diluted share) and fiscal 2010
of $2.5 million ($0.02 per diluted share).
SEASONALITY
Our sales volumes fluctuate seasonally. During fiscal 2012, 2011 and 2010,
our average sales per restaurant were highest in the winter and spring, followed
by the summer, and lowest in the fall. Holidays, changes in the economy, severe
weather and similar conditions may impact sales volumes seasonally in some
operating regions. Because of the seasonality of our business, results for any
quarter are not necessarily indicative of the results that may be achieved for
the full fiscal year.
IMPACT OF INFLATION
We attempt to minimize the annual effects of inflation through appropriate
planning, operating practices and menu price increases. During periods of higher
than expected inflationary costs, we have been able to reduce the annual impact
utilizing these strategies. We experienced higher than normal inflationary costs
during fiscal 2012 and were able to partially reduce the annual impact utilizing
these strategies. We do not believe inflation had a significant overall effect on
our annual results of operations during fiscal 2011 and 2010.
CRITICAL ACCOUNTING POLICIES
We prepare our consolidated financial statements in conformity with U.S.
generally accepted accounting principles. The preparation of these financial
statements requires us to make estimates and assumptions that affect the
reported amounts of assets and liabilities and disclosure of contingent assets
and liabilities at the date of the financial statements and the reported amounts
of sales and expenses during the reporting period. Actual results could differ
from those estimates.