Red Lobster 2012 Annual Report Download
Download and view the complete annual report
Please find the complete 2012 Red Lobster annual report below. You can navigate through the pages in the report by either clicking on the pages listed below, or by using the keyword search tool below to find specific information within the annual report.-
 1
1 -
 2
2 -
 3
3 -
 4
4 -
 5
5 -
 6
6 -
 7
7 -
 8
8 -
 9
9 -
 10
10 -
 11
11 -
 12
12 -
13
-
14
-
15
-
16
-
17
-
18
-
19
-
20
-
21
-
22
-
23
-
24
-
25
-
26
-
27
-
28
-
29
-
30
-
31
-
32
-
33
-
34
-
35
-
36
-
37
-
38
-
39
-
40
-
41
-
42
-
43
-
44
-
45
-
46
-
47
-
48
-
49
-
50
-
51
-
52
-
53
-
54
-
55
-
56
-
57
-
58
-
59
-
60
-
61
-
62
-
63
-
64
-
65
-
66
-
67
-
68
-
69
-
70
-
71
-
72
-
73
-
74
 |
 |
BUILT TO DELIVER
2012 Annual Report
Table of contents
-
Page 1
2012 Annual Report built to deliver -
Page 2
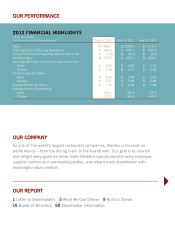
our perForMance 2012 Financial hiGhliGhtS Fiscal Year Ended (In Millions, Except Per Share Amounts) May 27, 2012 May 29, 2011 May 30, 2010 Sales Earnings from Continuing Operations Losses from Discontinued Operations, net of tax Net Earnings Earnings per Share from Continuing Operations: Basic ... -
Page 3
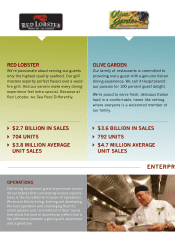
... perfect flavors over a wood fire grill. And our servers make every dining experience feel extra special. Because at Red Lobster, we Sea Food Differently. olive Garden Our family of restaurants is committed to providing every guest with a genuine Italian dining experience. We call it Hospitaliano... -
Page 4
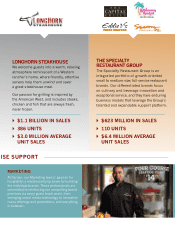
... service, and they have enduring business models that leverage the Group's talented and expandable support platform. ` $1.1 billion in SaleS ` 386 unitS ` $3.0 Million averaGe unit SaleS ` $623 Million in SaleS ` 110 unitS ` $6.4 Million averaGe unit SaleS iSe Support MarketinG At Darden... -
Page 5
...excluding Darden. Combined U.S. samerestaurant sales increased 4.6 percent in fiscal 2012 for the Company's Specialty Restaurant Group (The Capital Grille, Bahama Breeze, Seasons 52 and Eddie V's). The Company also had a 4.7 percent increase in sales in fiscal year 2012 due to new restaurants, which... -
Page 6
... losses from discontinued operations, combined diluted net earnings per share were $3.57 in fiscal 2012, compared to $3.39 in fiscal 2011. ` Olive Garden's total sales were $3.58 billion, up 2.5 percent from fiscal 2011. This reflected average annual sales per restaurant of $4.7 million... -
Page 7
... at Olive Garden and continued momentum at Red Lobster, LongHorn Steakhouse and our Specialty Restaurant Group brands, we continue to target compound annual same-restaurant sales growth of 2 percent to 4 percent over the long-term. We expect, however, that fiscal 2013 will be another year of... -
Page 8
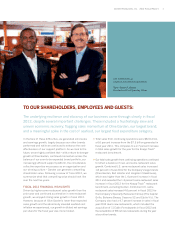
... recognition we earned from FORTUNE magazine in 2011 and again in 2012 as one of the "100 Best Companies to Work For." We are particularly proud because selection relies on an independently administered survey of employees - which, in our case, are largely hourly restaurant employees - and Darden is... -
Page 9
Darden Restaurants, Inc. 2012 Annual Report 5 What We can deliver ï¼ exceptional assets, collective expertise, a highly-efficient and effective support platform, winning culture and a proven track record. during the past five years we have created exceptional value, and now we are poised to use ... -
Page 10
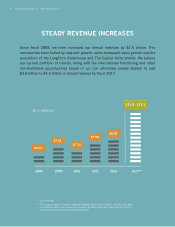
6 Darden Restaurants, Inc. 2012 Annual Report Steady revenue increaSeS Since fiscal 2008, we have increased our annual revenues by $1.4 billion. This increase has been fueled by new-unit growth, same-restaurant sales growth and the acquisition of the LongHorn Steakhouse and The Capital Grille ... -
Page 11
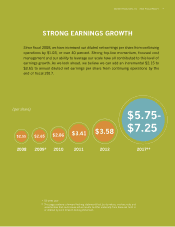
Darden Restaurants, Inc. 2012 Annual Report 7 StronG earninGS GroWth Since fiscal 2008, we have increased our diluted net earnings per share from continuing operations by $1.03, or over 40 percent. Strong top-line momentum, focused cost management and our ability to leverage our scale have all ... -
Page 12
... to continue investing in meaningful new-unit growth and remodeling existing restaurants, while also returning substantial capital to shareholders through dividends and share repurchase. $1,400$1,600 ($ in millions) $903 $895 $784 $767 $762 2008 2009* 2010 2011 2012 2017** * 53-week year... -
Page 13
Darden Restaurants, Inc. Annual Report Darden Restaurants, Inc. 2012 2012 Annual Report A/9 9 hoW are We built to deliver even More value? -
Page 14
... capital to shareholders. olive Garden Olive Garden ended the fiscal year with 792 restaurants and has the ultimate potential for 925 to 975 total locations. We expect to open more than 125 new restaurants by fiscal 2017, which will generate annual sales of $700 million and annual operating profit... -
Page 15
... reStaurant Group The Specialty Restaurant Group ended the fiscal year with 110 restaurants and has the ultimate potential for over 350 total locations. We expect to open more than 100 new-restaurant units by fiscal 2017, which will generate annual sales of $650 million and annual operating profit... -
Page 16
12 Darden Restaurants, Inc. 2012 Annual Report More SaleS our almost 2,000 existing restaurants are positioned to deliver 2 to 4 percent growth in same-restaurant sales through fiscal 2017. -
Page 17
... 2012 Annual Report 13 SaMe-reStaurant SaleS GroWth Marketing initiatives Our marketing teams are focused on developing initiatives to help drive same-restaurant sales growth while building brand equity and ensuring differentiated guest experiences. Among other things, in fiscal 2013: olive Garden... -
Page 18
14 14 Darden Restaurants, Inc. 2012 Annual Report More caSh 2013 2014 2015 2016 + 2017 $ 2.9 to 3.6 billion cuMulative dividendS and Share repurchaSe -
Page 19
... key restaurant team pay practices across Red Lobster, Olive Garden and LongHorn Steakhouse and identifying the optimal balance between full-time and part-time hourly employees at each brand. All this work was guided by our commitment to improve both the guest and employee experiences. These changes... -
Page 20
..., a global consumer products company. victoria d. harker Chief Financial Officer of Gannett Co., Inc., an international media and marketing solutions company. charles a. ledsinger, Jr. Chairman of Realty Investment Company, Inc., a private operating and investment company, and Sunburst Hospitality... -
Page 21
...of Earnings Consolidated Statements of Comprehensive Income Consolidated Balance Sheets Consolidated Statements of Changes in Stockholders' Equity Notes to Consolidated Financial Statements Five-Year Financial Summary Comparison of Five-Year Total Return for Darden Restaurants, Inc., S&P 500 Stock... -
Page 22
... to be completed early in the second quarter of fiscal 2013. See the subsection below entitled "Liquidity and Capital Resources" for further details. We expect blended U.S. same-restaurant sales in fiscal 2013 to increase between 1.0 percent and 2.0 percent for Olive Garden, Red Lobster and LongHorn... -
Page 23
... guest counts partially offset by a 0.1 percent increase in average check. Average annual sales per restaurant for Olive Garden were $4.7 million in fiscal 2012 compared to $4.8 million in fiscal 2011. Red Lobster's sales of $2.67 billion in fiscal 2012 were 5.9 percent above last fiscal year... -
Page 24
... Darden Restaurants, Inc. 2012 Annual Report Management's discussion and analysis of Financial condition and results of operations Darden LongHorn Steakhouse's sales of $1.12 billion in fiscal 2012 were 13.5 percent above last fiscal year, driven primarily by revenue from 32 net new restaurants... -
Page 25
... Annual Report 21 Management's discussion and analysis of Financial condition and results of operations Darden higher media costs. As a percent of sales, selling, general and administrative expenses increased from fiscal 2010 to fiscal 2011 primarily due to higher media expenses and compensation... -
Page 26
... 20 years, exercisable at our option, and require payment of property taxes, insurance and maintenance costs in addition to the rent payments. The consolidated financial statements reflect the same lease term for amortizing leasehold improvements as we use to determine capital versus operating lease... -
Page 27
...is discounted using a weighted-average cost of capital that reflects current market conditions. The projection uses management's best estimates of economic and market conditions over the projected period including growth rates in sales, costs and number of units, estimates of future expected changes... -
Page 28
24 Darden Restaurants, Inc. 2012 Annual Report Management's discussion and analysis of Financial condition and results of operations Darden income approach. We selected a weighted-average cost of capital for LongHorn Steakhouse and The Capital Grille of 11.0 percent. An increase in the ... -
Page 29
...Restaurants, Inc. 2012 Annual Report 25 Management's discussion and analysis of Financial condition and results of operations Darden FASB ASC Topic 740, Income Taxes, requires that a position taken or expected to be taken in a tax return be recognized (or derecognized) in the financial statements... -
Page 30
... Annual Report Management's discussion and analysis of Financial condition and results of operations Darden under a registration statement filed with the SEC on October 6, 2010. Discount and issuance costs, which totaled $5.1 million, are being amortized over the term of the New Senior Notes using... -
Page 31
... deferred compensation plan through fiscal 2022. (5) Includes interest on unrecognized income tax benefits of $1.7 million, $0.2 million of which relates to contingencies expected to be resolved within one year. (6) Includes letters of credit for $99.2 million of workers' compensation and general... -
Page 32
28 Darden Restaurants, Inc. 2012 Annual Report Management's discussion and analysis of Financial condition and results of operations Darden Our fixed-charge coverage ratio, which measures the number of times each year that we earn enough to cover our fixed charges, amounted to 5.0 times and 5.4 ... -
Page 33
...fiscal years 2012, 2011 and 2010, respectively, to our defined benefit pension plan to maintain its targeted funded status as of each annual valuation date. The expected long-term rate of return on plan assets component of our net periodic benefit cost is calculated based on the market-related value... -
Page 34
... financial statements. ForWard-lookinG StateMentS Statements set forth in or incorporated into this report regarding the expected net increase in the number of our restaurants, U.S. same-restaurant sales, total sales growth, diluted net earnings per share growth, and capital expenditures in fiscal... -
Page 35
Darden Restaurants, Inc. 2012 Annual Report 31 Management's discussion and analysis of Financial condition and results of operations Darden risks and uncertainties of ordinary business obligations, and those described in information incorporated into this report, the forward-looking statements ... -
Page 36
... regarding utilization of our assets and proper financial reporting. These formally stated and regularly communicated policies set high standards of ethical conduct for all employees. The Audit Committee of the Board of Directors meets at least quarterly to determine that management, internal... -
Page 37
... with the standards of the Public Company Accounting Oversight Board (United States), the consolidated balance sheets of Darden Restaurants, Inc. as of May 27, 2012 and May 29, 2011, and the related consolidated statements of earnings, comprehensive income, changes in stockholders' equity, and cash... -
Page 38
... accompanying consolidated balance sheets of Darden Restaurants, Inc. and subsidiaries as of May 27, 2012 and May 29, 2011, and the related consolidated statements of earnings, comprehensive income, changes in stockholders' equity and cash flows for each of the years in the three-year period ended... -
Page 39
Darden Restaurants, Inc. 2012 Annual Report 35 consolidated Statements of earnings Darden Fiscal Year Ended May 29, 2011 (in millions, except per share data) May 27, 2012 May 30, 2010 Sales Costs and expenses: Cost of sales: Food and beverage Restaurant labor Restaurant expenses Total cost of ... -
Page 40
...฀issued฀and฀outstanding฀ Retained earnings Treasury stock, 160.0 and 152.6 shares, at cost, respectively Accumulated other comprehensive income (loss) Unearned compensation Total stockholders' equity Total liabilities and stockholders' equity See accompanying notes to consolidated financial... -
Page 41
...-based compensation ESOP note receivable repayments Income tax benefits credited to equity Purchases of common stock for treasury (2.0 shares) Issuance of treasury stock under Employee Stock Purchase Plan and other plans (0.3 shares) Repayment of officer notes Balances at May 30, 2010 Net earnings... -
Page 42
... from sale of marketable securities Cash used in business acquisitions, net of cash acquired Increase in other assets Net cash used in investing activities of continuing operations Cash฀flows฀-฀financing฀activities Proceeds from issuance of common stock Income tax benefits credited to equity... -
Page 43
... SIGNIFICANT ACCOUNTING POLICIES operationS and principleS oF conSolidation The accompanying consolidated financial statements include the operations of Darden Restaurants, Inc. and its wholly owned subsidiaries (Darden, the Company, we, us or our). We own and operate the Red Lobster®, Olive Garden... -
Page 44
... maturity date, or both. Unrealized gains and losses, net of tax, on available-for-sale securities are carried in accumulated other comprehensive income (loss) within the consolidated financial statements and are reclassified into earnings when the securities mature or are sold. land, buildinGS and... -
Page 45
...is discounted using a weighted-average cost of capital that reflects current market conditions. The projection uses management's best estimates of economic and market conditions over the projected period including growth rates in sales, costs and number of units, estimates of future expected changes... -
Page 46
... with our accounting policy for goodwill and trademarks we performed our annual impairment test of our goodwill and trademarks as of the first day of our fiscal 2012 fourth quarter. As of the beginning of our fiscal fourth quarter, we had seven reporting units: Red Lobster, Olive Garden, LongHorn... -
Page 47
Darden Restaurants, Inc. 2012 Annual Report 43 notes to consolidated Financial Statements Darden inSurance accrualS Through the use of insurance program deductibles and self-insurance, we retain a significant portion of expected losses under our workers' compensation, employee medical and general... -
Page 48
...: 2012 Fiscal Year 2011 2010 (in millions) Advertising expense $357.2 $340.2 $311.9 Stock-baSed coMpenSation We recognize the cost of employee service received in exchange for awards of equity instruments based on the grant date fair value of those awards. We utilize the Black-Scholes option... -
Page 49
... into U.S. dollars using the exchange rates in effect at the balance sheet date. Results of operations are translated using the average exchange rates prevailing throughout the period. Translation gains and losses are reported as a separate component of other comprehensive income (loss). Aggregate... -
Page 50
... exceeded their fair value. Fair value is generally determined based on appraisals or sales prices of comparable assets and estimates of future cash flows. The results of operations for all Red Lobster, Olive Garden and LongHorn Steakhouse restaurants permanently closed in fiscal 2012, 2011 and 2010... -
Page 51
...under capital leases Land, buildings and equipment, net $ 854.1 $ 799.6 3,959.7 3,633.1 1,701.2 1,511.3 68.1 67.7 142.5 155.7 $ 6,725.6 $ 6,167.4 (2,758.3) (2,533.0) (16.0) (12.4) $ 3,951.3 $ 3,622.0 Non-qualified deferred compensation plan Sales and other taxes Insurance-related Employee benefits... -
Page 52
... fiscal years subsequent to May 27, 2012, and thereafter are as follows: (in millions) Fiscal Year Amount 2013 2014 2015 2016 2017 Thereafter Long-term debt $ 350.0 - - 100.0 - 1,355.9 $1,805.9 Subsequent to our fiscal 2012 year end, on June 18, 2012, we agreed to issue and sell $80.0 million... -
Page 53
... Restaurants, Inc. 2012 Annual Report 49 notes to consolidated Financial Statements Darden ` note 10 DERIVATIVE INSTRUMENTS AND HEDGING ACTIVITIES We use financial and commodities derivatives to manage interest rate, equitybased compensation and commodities pricing and foreign currency exchange... -
Page 54
... and 2016. We did not elect hedge accounting with the expectation that changes in the fair value of the equity forward contracts would offset changes in the fair value of the performance stock units and Darden stock investments in the non-qualified deferred compensation plan within selling, general... -
Page 55
... the consolidated statements of earnings are as follows: Location of Gain (Loss) Recognized in Earnings Amount of Gain (Loss) Recognized in Earnings Fiscal Year (in millions) 2012 2011 2010 Commodity contracts Equity forwards Equity forwards Cost of sales Cost of sales (2) Selling, general and... -
Page 56
52 Darden Restaurants, Inc. 2012 Annual Report notes to consolidated Financial Statements Darden (in millions) Fair Value of Assets (Liabilities) Items Measured at Fair Value at May 29, 2011 Quoted Prices in Active Market Significant Other for Identical Assets (Liabilities) Observable Inputs (... -
Page 57
Darden Restaurants, Inc. 2012 Annual Report 53 notes to consolidated Financial Statements Darden ` note 12 FINANCIAL INSTRUMENTS Marketable securities are carried at fair value and consist of available-for-sale securities related to insurance funding requirements for our workers' compensation and... -
Page 58
54 Darden Restaurants, Inc. 2012 Annual Report notes to consolidated Financial Statements Darden ` note 14 LEASES An analysis of rent expense incurred related to restaurants in continuing operations is as follows: (in millions) Capitalized interest was computed using our average borrowing rate.... -
Page 59
...Inc. 2012 Annual Report 55 notes to consolidated Financial Statements Darden The following table is a reconciliation of the U.S. statutory income tax rate to the effective income tax rate from continuing operations included in the accompanying consolidated statements of earnings: 2012 Fiscal Year... -
Page 60
...related to the defined benefit pension plans and postretirement benefit plans, which are funded on a pay-as-you-go basis, were as follows: (in millions) 2012 Fiscal Year 2011 2010 Defined benefit pension plans funding Postretirement benefit plan funding $22.2 0.5 $12.9 0.3 $0.4 0.6 We expect... -
Page 61
... used to determine benefit obligations at May 27 and May 29 (1) Discount rate Rate of future compensation increases Weighted-average assumptions used to determine net expense for fiscal years ended May 27 and May 29 (2) Discount rate Expected long-term rate of return on plan assets Rate of future... -
Page 62
... on amounts reported for defined benefit pension plans. A quarter percentage point change in the defined benefit plans' discount rate and the expected long-term rate of return on plan assets would increase or decrease earnings before income taxes by $0.7 million and $0.5 million, respectively. The... -
Page 63
... notes to consolidated Financial Statements Darden Components of net periodic benefit cost included in continuing operations are as follows: (in millions) 2012 Defined Benefit Plans 2011 2010 2012 Postretirement Benefit Plan 2011 2010 Service cost Interest cost Expected return on plan assets... -
Page 64
... return purposes. Stocks received from private equity distributions are valued by the trustee at closing prices from national exchanges on the valuation date. Investments in private companies are valued by management based upon information provided by the respective third-party investment manager... -
Page 65
... (Level 3) Private Equity Energy & Real Estate Real Asset Securities Public Sector Private Funds (in millions) Total Beginning balance at May 30, 2010 Actual return on plan assets: Relating to assets still held at the reporting date Relating to assets sold during the period Purchases, sales, and... -
Page 66
... defined benefit plans. Amounts payable to highly compensated employees under the FlexComp plan totaled $201.4 million and $200.1 million at May 27, 2012 and May 29, 2011, respectively. These amounts are included in other current liabilities. The defined contribution plan includes an Employee Stock... -
Page 67
... the 2002 Plan. Stock-based compensation expense included in continuing operations was as follows: (in millions) 2012 Fiscal Year 2011 2010 Stock options Restricted stock/restricted stock units Darden stock units Performance stock units Employee stock purchase plan Director compensation program... -
Page 68
... our stock plans. This cost is expected to be recognized over a weighted-average period of 2.5 years. The total fair value of stock options that vested during fiscal 2012 was $21.1 million. Restricted stock and RSUs are granted at a value equal to the market price of our common stock on the date of... -
Page 69
... fiscal 2012 was $9.8 million. We maintain an Employee Stock Purchase Plan to provide eligible employees who have completed one year of service (excluding senior officers subject to Section 16(b) of the Securities Exchange Act of 1934, and certain other employees who are employed less than full time... -
Page 70
... Financial Statements Darden ` note 21 QUARTERLY DATA (UNAUDITED) The following table summarizes unaudited quarterly data for fiscal 2012 and fiscal 2011: Fiscal 2012 - Quarters Ended Feb. 26 May 27 (in millions, except per share data) Aug. 28 Nov. 27 Total Sales Earnings before income taxes... -
Page 71
... Restaurants, Inc. 2012 Annual Report 67 Five-year Financial Summary Darden Fiscal Year Ended May 30, 2010 (in millions, except per share data) May 27, 2012 May 29, 2011 May 31, 2009 (2) May 25, 2008 Operating Results (3) Sales Costs and expenses: Cost of sales: Food and beverage Restaurant... -
Page 72
... respect to these forward-looking statements is set forth in "Management's Discussion and Analysis of Financial Condition and Results of Operations - Forward-Looking Statements." Shareholder reports/investor inquiries Shareholders seeking information about Darden Restaurants, Inc. are invited to... -
Page 73
eXecutive and operatinG teaMS ronald bojalad Senior Vice President, Group Human Resources JJ buettgen Senior Vice President, Chief Marketing Officer John caron President, Olive Garden david George President, LongHorn Steakhouse valerie insignares Senior Vice President, Chief Restaurant ... -
Page 74
1000 DARDEN CENTER DRIVE ORLANDO, FL 32837 407-245-4000 WWW.DARDEN.COM ®