Radio Shack 2011 Annual Report Download - page 82
Download and view the complete annual report
Please find page 82 of the 2011 Radio Shack annual report below. You can navigate through the pages in the report by either clicking on the pages listed below, or by using the keyword search tool below to find specific information within the annual report.-
 1
1 -
2
-
3
-
4
-
5
-
6
-
7
-
8
-
9
-
10
-
11
-
12
-
13
-
14
-
15
-
16
-
17
-
18
-
19
-
20
-
21
-
22
-
23
-
24
-
25
-
26
-
27
-
28
-
29
-
30
-
31
-
32
-
33
-
34
-
35
-
36
-
37
-
38
-
39
-
40
-
41
-
42
-
43
-
44
-
45
-
46
-
47
-
48
-
49
-
50
-
51
-
52
-
53
-
54
-
55
-
56
-
57
-
58
-
59
-
60
-
61
-
62
-
63
-
64
-
65
-
66
-
67
-
68
-
69
-
70
-
71
-
 72
72 -
 73
73 -
 74
74 -
 75
75 -
 76
76 -
 77
77 -
 78
78 -
 79
79 -
 80
80 -
 81
81 -
 82
82 -
 83
83 -
 84
84 -
 85
85 -
 86
86 -
 87
87 -
 88
88 -
 89
89 -
 90
90 -
 91
91 -
 92
92
 |
 |

74
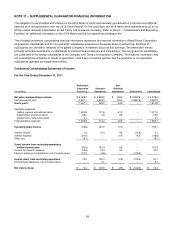
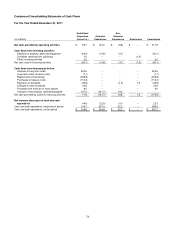
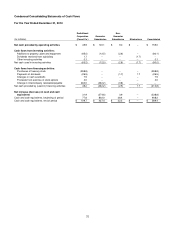
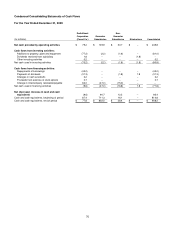
Condensed Consolidating Statements of Cash Flows
For the Year Ended December 31, 2011
(In millions)
RadioShack
Corporation
(Parent Co.)
Guarantor
Subsidiaries
Non-
Guarantor
Subsidiaries
Eliminations
Consolidated
Net cash provided by operating activities $ 93.7 $ 134.0 $ (9.8) $ -- $ 217.9
Cash flows from investing activities:
Additions to property, plant and equipment (64.2) (14.8) (3.1) -- (82.1)
Dividends received from subsidiary 1.5 -- -- (1.5) --
Other investing activities 2.0 -- -- -- 2.0
Net cash used in investing activities (60.7) (14.8) (3.1) (1.5) (80.1)
Cash flows from financing activities:
Issuance of long-term notes 322.5 -- -- -- 322.5
Long-term notes issuance costs (7.1) -- -- -- (7.1)
Repayments of borrowings (306.8) -- -- -- (306.8)
Purchases of treasury stock (113.3) -- -- -- (113.3)
Payments of dividends (49.6) -- (1.5) 1.5 (49.6)
Changes in cash overdrafts 32.8 -- -- -- 32.8
Proceeds from exercise of stock options 6.0 -- -- -- 6.0
Change in intercompany receivable/payable 127.4 (141.7) 14.3 -- --
Net cash provided by (used in) financing activities 11.9 (141.7) 12.8 1.5 (115.5)
Net increase (decrease) in cash and cash
equivalents
44.9
(22.5)
(0.1)
--
22.3
Cash and cash equivalents, beginning of period 109.7 427.4 32.3 -- 569.4
Cash and cash equivalents, end of period $ 154.6 $ 404.9 $ 32.2 $ -- $ 591.7