Radio Shack 2011 Annual Report Download - page 75
Download and view the complete annual report
Please find page 75 of the 2011 Radio Shack annual report below. You can navigate through the pages in the report by either clicking on the pages listed below, or by using the keyword search tool below to find specific information within the annual report.-
 1
1 -
2
-
3
-
4
-
5
-
6
-
7
-
8
-
9
-
10
-
11
-
12
-
13
-
14
-
15
-
16
-
17
-
18
-
19
-
20
-
21
-
22
-
23
-
24
-
25
-
26
-
27
-
28
-
29
-
30
-
31
-
32
-
33
-
34
-
35
-
36
-
37
-
38
-
39
-
40
-
41
-
42
-
43
-
44
-
45
-
46
-
47
-
48
-
49
-
50
-
51
-
52
-
53
-
54
-
55
-
56
-
57
-
58
-
59
-
60
-
61
-
62
-
63
-
64
-
 65
65 -
 66
66 -
 67
67 -
 68
68 -
 69
69 -
 70
70 -
 71
71 -
 72
72 -
 73
73 -
 74
74 -
 75
75 -
 76
76 -
 77
77 -
 78
78 -
 79
79 -
 80
80 -
 81
81 -
 82
82 -
 83
83 -
 84
84 -
 85
85 -
86
-
87
-
88
-
89
-
90
-
91
-
92
 |
 |

67
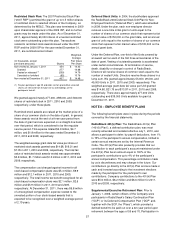
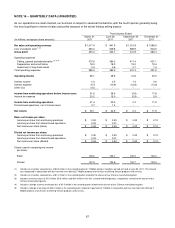
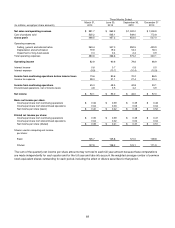
NOTE 16 – QUARTERLY DATA (UNAUDITED)
As our operations are retail oriented, our business is subject to seasonal fluctuations, with the fourth quarter generally being
the most significant in terms of sales and profits because of the winter holiday selling season.
Three Months Ended
(In millions, except per share amounts)
March 31,
2011
June 30,
2011
September 30,
2011
December 31
2011
Net sales and operating revenues $ 1,017.4 $ 941.9 $ 1,031.8 $ 1,386.9
Cost of products sold
(
1
)
(2)
563.0 509.8 589.9 904.5
Gross profit 454.4 432.1 441.9 482.4
Operating expenses:
Selling, general and administrative
(
3
)
(4) (5)
370.6 364.3 411.4 431.1
Depreciation and amortization 18.3 18.3 19.2 19.4
Impairment of long-lived assets 0.4 0.6 0.7 1.4
Total operating expenses 389.3 383.2 431.3 451.9
Operating income 65.1 48.9 10.6 30.5
Interest income 0.3 0.5 1.4 0.9
Interest expense (9.7) (10.9) (12.6) (13.6)
Other loss (4.1) -- -- --
Income from continuing operations before income taxes 51.6 38.5 (0.6) 17.8
Income tax expense 20.2 15.0 (0.9) 5.9
Income from continuing operations 31.4 23.5 0.3 11.9
Discontinued operations, net of income taxes 3.7 1.4 -- --
Net income $ 35.1 $ 24.9 $ 0.3 $ 11.9
Basic net income per share:
Income per share from continuing operations $ 0.30 $ 0.23 $ 0.00 $ 0.12
Income per share from discontinued operations 0.03 0.01 -- --
Net income per share (basic) $ 0.33 $ 0.24 $ 0.00 $ 0.12
Diluted net income per share:
Income per share from continuing operations $ 0.30 $ 0.23 $ 0.00 $ 0.12
Income per share from discontinued operations 0.03 0.01 -- --
Net income per share (diluted) $ 0.33 $ 0.24 $ 0.00 $ 0.12
Shares used in computing net income
per share:
Basic 106.2 103.7 100.2 100.0
Diluted 107.4 104.6 100.7 100.4
(1) Includes an inventory valuation loss of $3.0 million in the second quarter for T-Mobile wireless handsets we had on hand at June 30, 2011. This amount
was recognized in
conjunction with our transition from offering T-Mobile products and services to offering Verizon products and services.
(2) Includes an inventory valuation loss of $1.2 million in the second quarter related to the closure of our Chinese manufacturing plant.
(3) Includes severance costs of $1.5 million, $5.6 million, and $0.4 million in the first, second and third quarters, respectively, related to the closure of our
Chinese manufacturing plant.
(4) Includes a foreign currency exchange loss of $1.5 million in the second quarter related to the closure of our Chinese manufacturing plant.
(5) Includes a charge to earnings of $23.4 million in the second quarter related to a payment to T-Mobile in conjunction with our transition from offering T-
Mobile products and services to offering Verizon products and services.