Radio Shack 2011 Annual Report Download - page 35
Download and view the complete annual report
Please find page 35 of the 2011 Radio Shack annual report below. You can navigate through the pages in the report by either clicking on the pages listed below, or by using the keyword search tool below to find specific information within the annual report.-
 1
1 -
2
-
3
-
4
-
5
-
6
-
7
-
8
-
9
-
10
-
11
-
12
-
13
-
14
-
15
-
16
-
17
-
18
-
19
-
20
-
21
-
22
-
23
-
24
-
 25
25 -
 26
26 -
 27
27 -
 28
28 -
 29
29 -
 30
30 -
 31
31 -
 32
32 -
 33
33 -
 34
34 -
 35
35 -
 36
36 -
 37
37 -
 38
38 -
 39
39 -
 40
40 -
 41
41 -
 42
42 -
 43
43 -
 44
44 -
 45
45 -
46
-
47
-
48
-
49
-
50
-
51
-
52
-
53
-
54
-
55
-
56
-
57
-
58
-
59
-
60
-
61
-
62
-
63
-
64
-
65
-
66
-
67
-
68
-
69
-
70
-
71
-
72
-
73
-
74
-
75
-
76
-
77
-
78
-
79
-
80
-
81
-
82
-
83
-
84
-
85
-
86
-
87
-
88
-
89
-
90
-
91
-
92
 |
 |

27
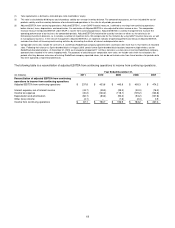
and $245.8 million in 2009. We do not intend for the
presentation of free cash flow, a non-GAAP financial
measure, to be considered in isolation or as a substitute for
measures prepared in accordance with GAAP, nor do we
intend to imply that free cash flow represents cash flow
available for discretionary expenditures.
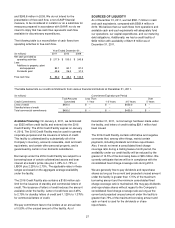
The following table is a reconciliation of cash flows from
operating activities to free cash flow.
Year Ended December 31,
(In millions) 2011 2010
2009
Net cash provided by
operating activities
$ 217.9
$ 155.0
$ 245.8
Less:
Additions to property, plant
and equipment
82.1
80.1
81.0
Dividends paid 49.6
26.5
31.3
Free cash flow $ 86.2
$ 48.4
$ 133.5
SOURCES OF LIQUIDITY
As of December 31, 2011, we had $591.7 million in cash
and cash equivalents, compared with $569.4 million in
2010. We believe that our cash flows from operations and
available cash and cash equivalents will adequately fund
our operations, our capital expenditures, and our maturing
debt obligations. Additionally, we had a credit facility of
$450 million with availability of $421.9 million as of
December 31, 2011.
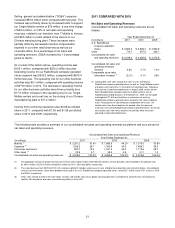
The table below lists our credit commitments from various financial institutions at December 31, 2011.
(In millions) Commitment Expiration per Period
Credit Commitments
Total Amounts
Committed
Less Than
1 Year
1-3 Years
3-5 Years
Over
5 Years
Lines of credit $450.0 $ -- $ -- $450.0 $ --
Standby letters of credit -- -- -- -- --
Total commercial commitments $450.0 $ -- $ -- $450.0 $ --
Available Financing: On January 4, 2011, we terminated
our $325 million credit facility and entered into the 2016
Credit Facility. The 2016 Credit Facility expires on January
4, 2016. The 2016 Credit Facility may be used for general
corporate purposes and the issuance of letters of credit.
This facility is collateralized by substantially all of the
Company’s inventory, accounts receivable, cash and cash
equivalents, and certain other personal property, and is
guaranteed by certain of our domestic subsidiaries.
Borrowings under the 2016 Credit Facility are subject to a
borrowing base of certain collateralized assets and bear
interest at a bank’s prime rate plus 1.25% to 1.75% or
LIBOR plus 2.25% to 2.75%. The applicable rates in these
ranges are based on the aggregate average availability
under the facility.
The 2016 Credit Facility also contains a $150 million sub-
limit for the issuance of standby and commercial letters of
credit. The issuance of letters of credit reduces the amount
available under the facility. Letter of credit fees are 2.25%
to 2.75% for standby letters of credit and 1.125% to 1.375%
for commercial letters of credit.
We pay commitment fees to the lenders at an annual rate
of 0.50% of the unused amount of the facility. As of
December 31, 2011, no borrowings had been made under
the facility, and letters of credit totaling $28.1 million had
been issued.
The 2016 Credit Facility contains affirmative and negative
covenants that, among other things, restrict certain
payments, including dividends and share repurchases.
Also, if we do not meet a consolidated fixed charge
coverage ratio during a trailing twelve-month period, the
availability under our credit facility will be reduced by the
greater of 12.5% of the borrowing base or $45 million. We
currently anticipate that we will be in compliance with the
consolidated fixed charge coverage ratio during 2012.
We are generally free to pay dividends and repurchase
shares as long as the current and projected unused amount
under the facility is greater than 17.5% of the maximum
borrowing amount and the minimum consolidated fixed
charge coverage ratio is maintained. We may pay dividends
and repurchase shares without regard to the Company's
consolidated fixed charge coverage ratio as long as the
current and projected unused amount under the facility is
greater than 75% of the maximum borrowing amount and
cash on hand is used for the dividends or share
repurchases.