Radio Shack 2011 Annual Report Download - page 31
Download and view the complete annual report
Please find page 31 of the 2011 Radio Shack annual report below. You can navigate through the pages in the report by either clicking on the pages listed below, or by using the keyword search tool below to find specific information within the annual report.-
 1
1 -
2
-
3
-
4
-
5
-
6
-
7
-
8
-
9
-
10
-
11
-
12
-
13
-
14
-
15
-
16
-
17
-
18
-
19
-
20
-
 21
21 -
 22
22 -
 23
23 -
 24
24 -
 25
25 -
 26
26 -
 27
27 -
 28
28 -
 29
29 -
 30
30 -
 31
31 -
 32
32 -
 33
33 -
 34
34 -
 35
35 -
 36
36 -
 37
37 -
 38
38 -
 39
39 -
 40
40 -
 41
41 -
42
-
43
-
44
-
45
-
46
-
47
-
48
-
49
-
50
-
51
-
52
-
53
-
54
-
55
-
56
-
57
-
58
-
59
-
60
-
61
-
62
-
63
-
64
-
65
-
66
-
67
-
68
-
69
-
70
-
71
-
72
-
73
-
74
-
75
-
76
-
77
-
78
-
79
-
80
-
81
-
82
-
83
-
84
-
85
-
86
-
87
-
88
-
89
-
90
-
91
-
92
 |
 |

23
We expect this change in our sales mix to continue to affect
our gross margin rate in 2012 primarily because of:
customer migration to smartphones, the effect of Sprint and
Verizon offering the iPhone for all of 2012 compared with
less than full years in 2011, and the effect of our recently
opened Target Mobile centers being open for a full year.
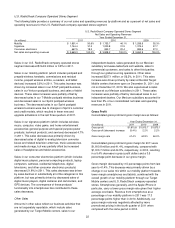
The gross margin rate for our U.S. RadioShack company-
operated stores segment decreased by 2.2 percentage
points in 2011, primarily due to a change in sales mix
towards lower margin smartphones as discussed above.
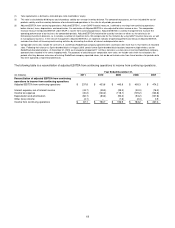
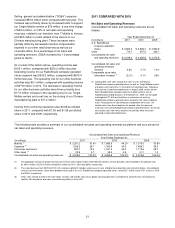
Selling, General and Administrative Expense
Our consolidated SG&A expense increased 6.3%, or $93.6 million, in 2011. This represents a 1.2 percentage point increase
as a percentage of net sales and operating revenues compared to 2010.
The table below summarizes the breakdown of various components of our consolidated SG&A expense and their related
percentages of total net sales and operating revenues.
Year Ended December 31,
2011 2010 2009
Dollars
% of
Sales &
Revenues
Dollars
% of
Sales &
Revenues
Dollars
% of
Sales &
Revenues
(In millions)
Compensation $ 693.4
15.8%
$ 663.1
15.5%
$ 617.6
15.2%
Rent and occupancy 261.5
6.0
265.3
6.2
266.2
6.5
Advertising
208.9
4.8
205.9
4.8
192.8
4.7
Other taxes (excludes income taxes) 108.3
2.5
97.7
2.3
97.8
2.4
Utilities 56.0
1.3
54.4
1.3
54.8
1.3
Insurance 49.6
1.1
45.9
1.1
44.6
1.1
Credit card fees 35.6
0.8
34.9
0.8
37.2
0.9
Professional fees 26.7
0.6
21.3
0.5
23.8
0.6
Repairs and maintenance 25.7
0.6
20.1
0.5
22.3
0.6
Licenses 14.9
0.3
13.2
0.3
11.5
0.3
Printing, postage and office supplies 9.0
0.2
6.9
0.2
7.7
0.2
Recruiting, training and employee relations 6.5
0.2
5.4
0.1
5.7
0.1
Travel 6.4
0.1
4.9
0.1
4.0
0.1
Matching contributions to savings plans 4.9
0.1
5.4
0.1
5.9
0.1
Warranty and product repair 1.3
--
2.2
0.1
2.7
0.1
Other 68.7
1.6
37.2
0.9
40.4
1.0
$ 1,577.4
36.0%
$ 1,483.8
34.8%
$ 1,435.0
35.2%
The increase in SG&A expense was primarily driven by increased costs to support our Target Mobile centers of approximately
$76 million, a one-time charge of $23.4 million related to our transition from T-Mobile to Verizon classified as other SG&A, and
$9.5 million in costs related to the closure of our Chinese manufacturing plant. These increases were partially offset by
decreased incentive compensation expense in our other retail channels as well as our corporate office.