Radio Shack 2011 Annual Report Download - page 2
Download and view the complete annual report
Please find page 2 of the 2011 Radio Shack annual report below. You can navigate through the pages in the report by either clicking on the pages listed below, or by using the keyword search tool below to find specific information within the annual report.-
 1
1 -
 2
2 -
 3
3 -
 4
4 -
 5
5 -
 6
6 -
 7
7 -
 8
8 -
 9
9 -
 10
10 -
 11
11 -
 12
12 -
 13
13 -
14
-
15
-
16
-
17
-
18
-
19
-
20
-
21
-
22
-
23
-
24
-
25
-
26
-
27
-
28
-
29
-
30
-
31
-
32
-
33
-
34
-
35
-
36
-
37
-
38
-
39
-
40
-
41
-
42
-
43
-
44
-
45
-
46
-
47
-
48
-
49
-
50
-
51
-
52
-
53
-
54
-
55
-
56
-
57
-
58
-
59
-
60
-
61
-
62
-
63
-
64
-
65
-
66
-
67
-
68
-
69
-
70
-
71
-
72
-
73
-
74
-
75
-
76
-
77
-
78
-
79
-
80
-
81
-
82
-
83
-
84
-
85
-
86
-
87
-
88
-
89
-
90
-
91
-
92
 |
 |

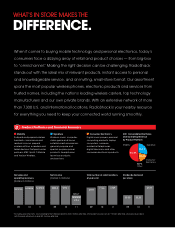
When it comes to buying mobile technology and personal electronics, today’s
consumers face a dizzying array of retail and product choices — from big-box
to “omnichannel.” Making the right decision can be challenging. RadioShack
stands out with the ideal mix of relevant products, instant access to personal
and knowledgeable service, and an inviting, small-store format. Our assortment
spans the most popular wireless phones, electronic products and services from
trusted names, including the nation’s leading wireless carriers, top technology
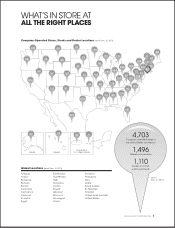
manufacturers and our own private brands. With an extensive network of more
than 7,300 U.S. and international locations, RadioShack is your nearby resource
for everything you need to keep your connected world running smoothly.
Mobility
Postpaid and prepaid wireless
handsets, commissions and
residual income, prepaid
wireless airtime, e-readers and
tablet devices. Postpaid carrier
partners: AT&T, Sprint, T-Mobile
and Verizon Wireless.
Signature
Wireless, music, computer,
video game and home
entertainment accessories;
general-purpose and
special-purpose power
products; headphones;
technical products;
and services.
Consumer Electronics
Digital music players, personal
computing products, laptop
computers, cameras,
residential telephones,
digital televisions and other
consumer electronics products.
2011 Consolidated Net Sales
and Operating Revenue
by Product Platform
Product Platforms and Financial Summary
Signature
51.4%
28.7%
19.2%
Mobility
Consumer
Electronics
WHAT’S IN STORE MAKES THE
DIFFERENCE.
0.7%
Other
Net sales and
operating revenues
(Dollars in millions)
Net income
(Dollars in millions)
Total number of retail locations
at year end
Dividends declared
per share
*Excluding one-time items: Costs relating to the T-Mobile transition ($16.0 million after tax); China plant closure costs ($7.7 million after tax); and costs associated
with the early retirement of debt ($2.5 million after tax).
09 10 11
$4,073.6 $4,265.8 $4,378.0
09 10 11
$205.0 $206.1
$98.4*
$72.2
09 10 11
6,563 7,183 7,309
09 10 11
$0.25 $0.25
$0.50