Radio Shack 2011 Annual Report Download - page 29
Download and view the complete annual report
Please find page 29 of the 2011 Radio Shack annual report below. You can navigate through the pages in the report by either clicking on the pages listed below, or by using the keyword search tool below to find specific information within the annual report.-
 1
1 -
2
-
3
-
4
-
5
-
6
-
7
-
8
-
9
-
10
-
11
-
12
-
13
-
14
-
15
-
16
-
17
-
18
-
 19
19 -
 20
20 -
 21
21 -
 22
22 -
 23
23 -
 24
24 -
 25
25 -
 26
26 -
 27
27 -
 28
28 -
 29
29 -
 30
30 -
 31
31 -
 32
32 -
 33
33 -
 34
34 -
 35
35 -
 36
36 -
 37
37 -
 38
38 -
 39
39 -
40
-
41
-
42
-
43
-
44
-
45
-
46
-
47
-
48
-
49
-
50
-
51
-
52
-
53
-
54
-
55
-
56
-
57
-
58
-
59
-
60
-
61
-
62
-
63
-
64
-
65
-
66
-
67
-
68
-
69
-
70
-
71
-
72
-
73
-
74
-
75
-
76
-
77
-
78
-
79
-
80
-
81
-
82
-
83
-
84
-
85
-
86
-
87
-
88
-
89
-
90
-
91
-
92
 |
 |

21
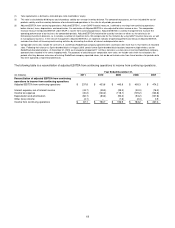
Selling, general and administrative (“SG&A”) expense
increased $93.6 million when compared with last year. This
increase was primarily driven by increased costs to support
our Target Mobile centers of $76 million, a one-time charge
of $23.4 million, or 0.5% of net sales and operating
revenues, related to our transition from T-Mobile to Verizon,
and $9.5 million in costs related to the closure of our
Chinese manufacturing plant. These increases were
partially offset by decreased incentive compensation
expense in our other retail channels as well as our
corporate office. As a percentage of net sales and
operating revenues, SG&A increased by 1.2 percentage
points to 36.0%.
As a result of the factors above, operating income was
$155.1 million, compared with $350.2 million last year.
Operating income for our RadioShack company-operated
stores segment was $530.2 million, compared with $675.4
million last year. The operating loss for our other business
activities was $0.1 million, compared with operating income
of $37.8 million in 2010. The decrease in operating income
for our other business activities was driven primarily by a
$17.0 million increase in the operating loss for our Target
Mobile centers and a net loss on the closing of our Chinese
manufacturing plant of $11.4 million.
Income from continuing operations was $0.65 per diluted
share in 2011, compared with $1.55 and $1.56 per diluted
share in 2010 and 2009, respectively.
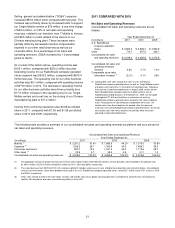
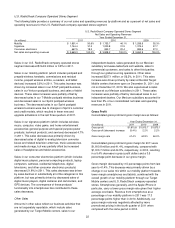
2011 COMPARED WITH 2010
Net Sales and Operating Revenues
Consolidated net sales and operating revenues are as
follows:
Year Ended December 31,
(In millions) 2011 2010
2009
U.S. RadioShack
company-operated
stores
$ 3,663.3
$ 3,808.2
$ 3,650.9
Other 714.7
457.6
422.7
Consolidated net sales
and operating revenues
$ 4,378.0
$ 4,265.8
$ 4,073.6
Consolidated net sales and
operating revenues
increase
2.6%
4.7%
1.0%
Comparable store sales
(decrease) increase (1)
(2.2%)
4.1%
0.8%
(1)
Comparable store sales include the sales of U.S. and Mexico
RadioShack company-operated stores as well as Target Mobile centers
and kiosks with more than 12 full months of recorded sales. Following
their closure as Sprint-branded kiosks in August 2009, certain former
Sprint-branded kiosk locations became multiple wireless carrier
RadioShack-branded locations. At December 31, 2009, we managed
and reported 111 of these locations as extensions of existing
RadioShack company-operated stores located in the same shopping
malls. For purposes of calculating our comparable store sales, we
include sales from these locations for periods after they became
extensions of existing RadioShack company-operated stores, but we do
not include sales from these locations for periods while they were
operated as Sprint-branded kiosks.
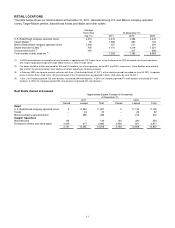
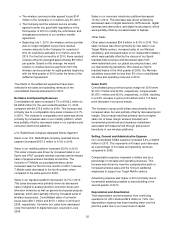
The following table provides a summary of our consolidated net sales and operating revenues by platform and as a percent of
net sales and operating revenues.
Consolidated Net Sales and Operating Revenues
Year Ended December 31,
(In millions) 2011 2010 2009
Mobility
(1)
$ 2,251.2 51.4%
$ 1,885.6 44.2%
$ 1,375.0 33.8%
Signature
(2)
1,256.2 28.7
1,303.9 30.6
1,486.7 36.5
Consumer electronics 840.7 19.2
1,041.0 24.4
1,170.8 28.7
Other sales
(3)
29.9 0.7
35.3 0.8
41.1 1.0
Consolidated net sales and operating revenues $ 4,378.0 100.0%
$ 4,265.8 100.0%
$ 4,073.6 100.0%
(1) The aggregate amount of upfront commission revenue and residual income received from wireless service providers and recorded in this platform was
$1,499.1 million, $1,270.5 million and $926.5 million for 2011, 2010 and 2009, respectively.
(2) The sales decrease from 2009 to 2010 in the signature platform includes a decrease in sales of digital-to-analog television converter boxes. Consolidated
sales of converter boxes, which were predominantly sold in our U.S. RadioShack company-operated stores, were $33.7 million and $170.1 million in 2010
and 2009, respectively.
(3) Other sales include outside sales from repair services and outside sales of our global sourcing operations and domestic and overseas manufacturing
facilities. We closed our overseas manufacturing facility in June 2011.