Radio Shack 2011 Annual Report Download - page 34
Download and view the complete annual report
Please find page 34 of the 2011 Radio Shack annual report below. You can navigate through the pages in the report by either clicking on the pages listed below, or by using the keyword search tool below to find specific information within the annual report.-
 1
1 -
2
-
3
-
4
-
5
-
6
-
7
-
8
-
9
-
10
-
11
-
12
-
13
-
14
-
15
-
16
-
17
-
18
-
19
-
20
-
21
-
22
-
23
-
 24
24 -
 25
25 -
 26
26 -
 27
27 -
 28
28 -
 29
29 -
 30
30 -
 31
31 -
 32
32 -
 33
33 -
 34
34 -
 35
35 -
 36
36 -
 37
37 -
 38
38 -
 39
39 -
 40
40 -
 41
41 -
 42
42 -
 43
43 -
 44
44 -
45
-
46
-
47
-
48
-
49
-
50
-
51
-
52
-
53
-
54
-
55
-
56
-
57
-
58
-
59
-
60
-
61
-
62
-
63
-
64
-
65
-
66
-
67
-
68
-
69
-
70
-
71
-
72
-
73
-
74
-
75
-
76
-
77
-
78
-
79
-
80
-
81
-
82
-
83
-
84
-
85
-
86
-
87
-
88
-
89
-
90
-
91
-
92
 |
 |

26
expenditures during this time compared with a higher level
of capital expenditures in 2005 and prior years.
Impairment of Long-Lived Assets
Impairment of long-lived assets was $4.0 million and $1.5
million in 2010 and 2009, respectively. In 2010, this amount
was related primarily to underperforming U.S. RadioShack
company-operated stores and certain test store formats. In
2009, these amounts were related primarily to
underperforming U.S. RadioShack company-operated
stores and kiosk locations.
Net Interest Expense
Consolidated net interest expense, which is interest
expense net of interest income, was $39.3 million in both
2010 and 2009.
In 2010, interest expense primarily consisted of interest
paid at the stated coupon rate on our outstanding notes, the
non-cash amortization of the discount on our convertible
notes, cash received on our interest rate swaps, and the
non-cash change in fair value of our interest rate swaps.
Interest expense decreased $2.2 million in 2010. This
decrease was primarily driven by the reduced principal
balance of our 7.375% notes due May 15, 2011, (the “2011
Notes”) resulting from the September 2009 repurchase of
$43.2 million of the principal amount of the 2011 Notes and
increased payments received on our interest rate swap
contracts during 2010. Non-cash interest expense was
$15.2 million in 2010 compared with $13.7 million in 2009.
Interest income decreased $2.2 million in 2010. This
decrease was primarily due to lower average cash
balances in the second half of 2010.
Income Tax Expense
Our effective tax rate for 2010 was 38.7%, compared with
37.5% for 2009. The 2010 effective tax rate was affected by
the net reversal of approximately $1.2 million in previously
unrecognized tax benefits, deferred tax assets and accrued
interest due to the effective settlement of state income tax
matters during the period. These discrete items lowered the
effective tax rate by 0.4 percentage points.
The 2009 effective tax rate was affected by the net reversal
of approximately $6.1 million in previously unrecognized tax
benefits, deferred tax assets and accrued interest due to
the effective settlement of state income tax matters during
the period. These discrete items lowered the effective tax
rate by 1.9 percentage points.
RECENTLY ISSUED ACCOUNTING
PRONOUNCEMENTS
Refer to Note 2 – “Summary of Significant Accounting
Policies” under the section titled “New Accounting
Standards” in the Notes to Consolidated Financial
Statements.
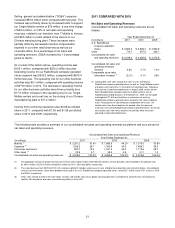
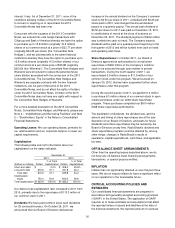
LIQUIDITY AND CAPITAL RESOURCES
Cash Flow Overview
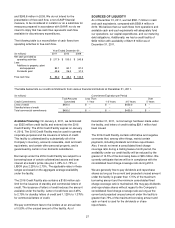
Operating Activities: Cash provided by operating activities
in 2011 was $217.9 million, compared with $155.0 million in
2010. Cash flows from operating activities are comprised of
net income plus non-cash adjustments to net income and
working capital components. Cash provided by net income
plus non-cash adjustments to net income was $219.2
million and $343.9 million in 2011 and 2010, respectively.
The decrease in net income plus non-cash adjustments
was primarily driven by decreased net income. Cash used
in working capital components was $1.3 million and $188.9
million in 2011 and 2010, respectively. The decrease in
cash used in working capital components in 2011 was
primarily driven by a larger accounts payable balance. Our
accounts payable balance was larger at December 31,
2011, than it was at December 31, 2010, because of
differences in the timing of invoice receipts and related
payments in 2011 compared with 2010.
Investing Activities: Cash used in investing activities was
$80.1 million and $80.0 million in 2011 and 2010,
respectively. Capital expenditures of $82.1 million in 2011
were consistent with the $80.1 million we spent in 2010.
Capital expenditures primarily related to information system
projects, Target Mobile centers, and our U.S. RadioShack
company-operated stores.
Financing Activities: Net cash used in financing activities
was $115.5 million in 2011 compared with $413.8 million in
2010. Our net cash used in financing activities for 2011 was
primarily driven by the repurchase of $113.3 million of our
common stock and the payment of a $49.6 million annual
dividend. Our net cash used in financing activities for 2010
was primarily driven by the repurchase of $398.8 million of
our common stock.
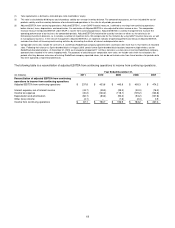
Free Cash Flow: Our free cash flow, defined as cash flows
from operating activities less dividends paid and additions to
property, plant and equipment, was $86.2 million in 2011,
$48.4 million in 2010, and $133.5 million in 2009. The
increase in free cash flow for 2011 was attributable to
increased cash flow from operating activities as described
above.
We believe free cash flow is a relevant indicator of our
ability to repay maturing debt, change dividend payments or
fund other uses of capital that management believes will
enhance shareholder value. The comparable financial
measure to free cash flow under generally accepted
accounting principles is cash flows from operating activities,
which was $217.9 million in 2011, $155.0 million in 2010,