Radio Shack 2011 Annual Report Download - page 76
Download and view the complete annual report
Please find page 76 of the 2011 Radio Shack annual report below. You can navigate through the pages in the report by either clicking on the pages listed below, or by using the keyword search tool below to find specific information within the annual report.-
 1
1 -
2
-
3
-
4
-
5
-
6
-
7
-
8
-
9
-
10
-
11
-
12
-
13
-
14
-
15
-
16
-
17
-
18
-
19
-
20
-
21
-
22
-
23
-
24
-
25
-
26
-
27
-
28
-
29
-
30
-
31
-
32
-
33
-
34
-
35
-
36
-
37
-
38
-
39
-
40
-
41
-
42
-
43
-
44
-
45
-
46
-
47
-
48
-
49
-
50
-
51
-
52
-
53
-
54
-
55
-
56
-
57
-
58
-
59
-
60
-
61
-
62
-
63
-
64
-
65
-
 66
66 -
 67
67 -
 68
68 -
 69
69 -
 70
70 -
 71
71 -
 72
72 -
 73
73 -
 74
74 -
 75
75 -
 76
76 -
 77
77 -
 78
78 -
 79
79 -
 80
80 -
 81
81 -
 82
82 -
 83
83 -
 84
84 -
 85
85 -
 86
86 -
87
-
88
-
89
-
90
-
91
-
92
 |
 |

68
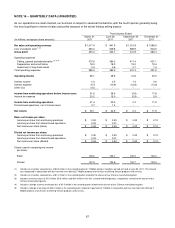
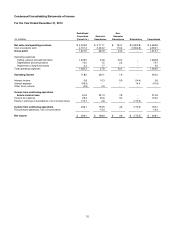
Three Months Ended
(In millions, except per share amounts)
March 31,
2010
June 30,
2010
September 30,
2010
December 31
2010
Net sales and operating revenues $ 991.7 $ 962.3 $ 1,002.0 $ 1,309.8
Cost of products sold 525.2 505.1 549.0 772.8
Gross profit 466.5 457.2 453.0 537.0
Operating expenses:
Selling, general and administrative 363.4 347.0 352.5 420.9
Depreciation and amortization 19.9 19.2 18.3 18.3
Impairment of long-lived assets 0.3 0.4 2.4 0.9
Total operating expenses 383.6 366.6 373.2 440.1
Operating income 82.9 90.6 79.8 96.9
Interest income 0.6 0.7 0.8 0.5
Interest expense (9.9) (10.7) (10.4) (10.9)
Income from continuing operations before income taxes 73.6 80.6 70.2 86.5
Income tax expense 28.3 31.1 27.4 33.4
Income from continuing operations 45.3 49.5 42.8 53.1
Discontinued operations, net of income taxes 4.8 3.5 3.2 3.9
Net income $ 50.1 $ 53.0 $ 46.0 $ 57.0
Basic net income per share:
Income per share from continuing operations $ 0.36 $ 0.39 $ 0.35 $ 0.48
Income per share from discontinued operations 0.04 0.03 0.03 0.04
Net income per share (basic) $ 0.40 $ 0.42 $ 0.38 $ 0.52
Diluted net income per share:
Income per share from continuing operations $ 0.35 $ 0.39 $ 0.35 $ 0.47
Income per share from discontinued operations 0.04 0.02 0.02 0.04
Net income per share (diluted) $ 0.39 $ 0.41 $ 0.37 $ 0.51
Shares used in computing net income
per share:
Basic 125.7 125.8 121.0 109.8
Diluted 127.9 128.2 123.1 111.9
The sum of the quarterly net income per share amounts may not total to each full year amount because these computations
are made independently for each quarter and for the full year and take into account the weighted average number of common
stock equivalent shares outstanding for each period, including the effect of dilutive securities for that period.