Radio Shack 2011 Annual Report Download - page 64
Download and view the complete annual report
Please find page 64 of the 2011 Radio Shack annual report below. You can navigate through the pages in the report by either clicking on the pages listed below, or by using the keyword search tool below to find specific information within the annual report.
56
The following table lists the assumptions used in calculating
the fair value of stock options granted during each year:
Valuation Assumptions
(1)
2011
2010
2009
Risk free interest rate
(2)
1.6%
2.3%
2.0%
Expected dividend yield 2.0%
1.3%
1.8%
Expected stock price volatility
(3)
43.0%
42.4%
50.4%
Expected life of stock options
(in years)(4)
5.4
5.4
5.4
(1) Forfeitures are estimated using historical experience and projected
employee turnover.
(2) Based on the U.S. Treasury constant maturity interest rate whose term
is consistent with the expected life of our stock options.
(3) We consider both the historical volatility of our stock price, as well as
implied volatilities from exchange-traded options on our stock.
(4) We estimate the expected life of stock options based upon historical
experience.
Information with respect to stock option activity under the above plans is as follows:
Shares
(In thousands)
Weighted Average
Exercise Price
Remaining
Contractual Life
(in years)
Aggregate
Intrinsic Value
(in millions)
Outstanding at January 1, 2011 8,517 $ 17.52
Grants 811 14.15
Exercised (623) 7.97
Expired (1,135) 36.53
Forfeited (221) 20.24
Outstanding at December 31, 2011 7,349 $ 14.94 2.3 $ 2.0
Exercisable at December 31, 2011
6,390
$ 15.12
1.7
$ 1.7
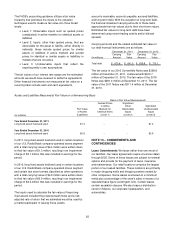
The weighted-average grant-date fair value of stock options granted during 2011, 2010 and 2009, was $4.84, $7.08 and $4.32,
respectively.
The aggregate intrinsic value of options exercised under our stock option plans was $3.5 million, $1.3 million, and $0.1 million
for 2011, 2010 and 2009, respectively. The aggregate intrinsic value is the amount by which the market price of our common
stock on the date of exercise exceeded the exercise price of the option. Net cash proceeds from the exercise of stock options
were $6.0 million, $4.0 million and $0.7 million in 2011, 2010 and 2009, respectively. The actual income tax benefit realized
from stock option exercises was $1.4 million, $0.5 million and zero, in 2011, 2010 and 2009, respectively.
The following table summarizes information concerning currently outstanding and exercisable options to purchase our
common stock:
(Share amounts in thousands) Options Outstanding Options Exercisable
Range of Exercise Prices
Shares
Outstanding
at Dec. 31, 2011
Weighted
Average
Remaining
Contractual Life
(in years)
Weighted
Average
Exercise Price
Shares
Exercisable
at Dec. 31, 2011
Weighted
Average
Exercise Price
$ 7.05 – 13.58 1,037 3.9 $ 8.45 660 $ 7.13
13.82 4,000 1.5 13.82 4,000 13.82
14.80 – 17.80 723 5.1 15.99 194 17.76
18.52 – 19.20 840 2.7 18.66 796 18.64
19.39 – 30.99 749 1.1 24.76 740 24.82
$ 7.05 – 30.99 7,349 2.3 $ 14.94 6,390 $ 15.12


