Radio Shack 2011 Annual Report Download - page 30
Download and view the complete annual report
Please find page 30 of the 2011 Radio Shack annual report below. You can navigate through the pages in the report by either clicking on the pages listed below, or by using the keyword search tool below to find specific information within the annual report.-
 1
1 -
2
-
3
-
4
-
5
-
6
-
7
-
8
-
9
-
10
-
11
-
12
-
13
-
14
-
15
-
16
-
17
-
18
-
19
-
 20
20 -
 21
21 -
 22
22 -
 23
23 -
 24
24 -
 25
25 -
 26
26 -
 27
27 -
 28
28 -
 29
29 -
 30
30 -
 31
31 -
 32
32 -
 33
33 -
 34
34 -
 35
35 -
 36
36 -
 37
37 -
 38
38 -
 39
39 -
 40
40 -
41
-
42
-
43
-
44
-
45
-
46
-
47
-
48
-
49
-
50
-
51
-
52
-
53
-
54
-
55
-
56
-
57
-
58
-
59
-
60
-
61
-
62
-
63
-
64
-
65
-
66
-
67
-
68
-
69
-
70
-
71
-
72
-
73
-
74
-
75
-
76
-
77
-
78
-
79
-
80
-
81
-
82
-
83
-
84
-
85
-
86
-
87
-
88
-
89
-
90
-
91
-
92
 |
 |

22
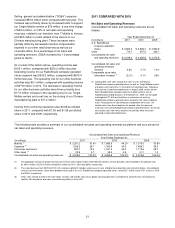
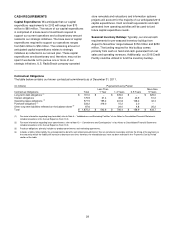
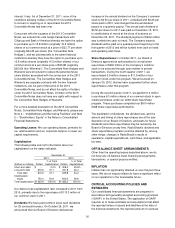
U.S. RadioShack Company-Operated Stores Segment
The following table provides a summary of our net sales and operating revenues by platform and as a percent of net sales and
operating revenues for the U.S. RadioShack company-operated stores segment.
U.S. RadioShack Company-Operated Stores Segment
Net Sales and Operating Revenues
Year Ended December 31,
(In millions) 2011 2010 2009
Mobility $ 1,851.4 50.6%
$ 1,753.7 46.1%
$ 1,289.9 35.3%
Signature 1,144.4 31.2
1,200.8 31.5
1,375.4 37.7
Consumer electronics 667.5 18.2
853.7 22.4
985.6 27.0
Net sales and operating revenues $ 3,663.3 100.0%
$ 3,808.2 100.0%
$ 3,650.9 100.0%
Sales in our U.S. RadioShack company-operated stores
segment decreased $144.9 million or 3.8% in 2011.
Sales in our mobility platform (which includes postpaid and
prepaid wireless handsets, commissions and residual
income, prepaid wireless airtime, e-readers, and tablet
devices) increased 5.6% in 2011. This sales increase was
driven by increased sales in our AT&T postpaid business,
sales in our Verizon postpaid business, and sales of tablet
devices. These sales increases were partially offset by
decreased sales in our T-Mobile postpaid wireless business
and decreased sales in our Sprint postpaid wireless
business. The decreased sales in our Sprint postpaid
wireless business were due to changes in Sprint’s customer
and credit models, which resulted in fewer new and
upgrade activations in the last three quarters of 2011.
Sales in our signature platform (which includes wireless,
music, computer, video game, and home entertainment
accessories; general purpose and special purpose power
products; technical products; and services) decreased 4.7%
in 2011. This sales decrease was primarily driven by
decreased sales of digital-to-analog television converter
boxes and related television antennas, music accessories,
and media storage, but was partially offset by increased
sales of headphones and tablet accessories.
Sales in our consumer electronics platform (which includes
digital music players, personal computing products, laptop
computers, cameras, residential telephones, digital
televisions, and other consumer electronics products)
decreased 21.8% in 2011. This sales decrease was driven
by sales declines in substantially all of the categories in this
platform, but was primarily driven by decreased sales of
digital music players, digital cameras and camcorders, and
GPS devices. The convergence of these products’
functionality into smartphones has contributed to these
sales decreases.
Other Sales
Amounts in other sales reflect our business activities that
are not separately reportable, which include sales
generated by our Target Mobile centers, sales to our
independent dealers, sales generated by our Mexican
subsidiary and www.radioshack.com website, sales to
commercial customers, and sales to other third parties
through our global sourcing operations. Other sales
increased $257.1 million, or 56.2%, in 2011. This sales
increase was driven primarily by sales at the 646 Target
Mobile centers that were open on December 31, 2011, but
not on December 31, 2010. We also experienced a sales
increase at our Mexican subsidiary in 2011. These sales
increases were partially offset by decreased sales to our
independent dealers. Our Mexican subsidiary accounted for
less than 5% of our consolidated net sales and operating
revenues in 2011.
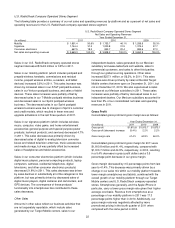
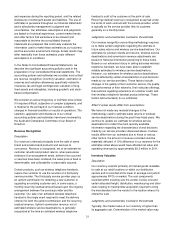
Gross Profit
Consolidated gross profit and gross margin are as follows:
Year Ended December 31,
(In millions) 2011
2010
2009
Gross profit $1,810.8
$1,913.7
$1,873.1
Gross profit (decrease) increase (5.4%)
2.2%
2.2%
Gross margin rate 41.4%
44.9%
46.0%
Consolidated gross profit and gross margin for 2011 were
$1,810.8 million and 41.4%, respectively, compared with
$1,913.7 million and 44.9%, respectively, in 2010, resulting
in a 5.4% decrease in gross profit dollars and a 3.5
percentage point decrease in our gross margin.
Gross margin decreased by 3.5 percentage points from last
year to 41.4%. This decrease was primarily driven by a
change in our sales mix within our mobility platform towards
lower margin smartphones and tablets, combined with the
overall growth of our mobility platform through our Target
Mobile centers and U.S. RadioShack company-operated
stores. Smartphones generally, and the Apple iPhone in
particular, carry a lower gross margin rate given their higher
average cost basis. Revenue from smartphones as a
percentage of our mobility platform in 2011 was 17.3
percentage points higher than in 2010. Additionally, our
gross margin rate was negatively affected by more
promotional pricing in the fourth quarter of 2011 when
compared with the same period in 2010.