Radio Shack 2011 Annual Report Download - page 33
Download and view the complete annual report
Please find page 33 of the 2011 Radio Shack annual report below. You can navigate through the pages in the report by either clicking on the pages listed below, or by using the keyword search tool below to find specific information within the annual report.-
 1
1 -
2
-
3
-
4
-
5
-
6
-
7
-
8
-
9
-
10
-
11
-
12
-
13
-
14
-
15
-
16
-
17
-
18
-
19
-
20
-
21
-
22
-
 23
23 -
 24
24 -
 25
25 -
 26
26 -
 27
27 -
 28
28 -
 29
29 -
 30
30 -
 31
31 -
 32
32 -
 33
33 -
 34
34 -
 35
35 -
 36
36 -
 37
37 -
 38
38 -
 39
39 -
 40
40 -
 41
41 -
 42
42 -
 43
43 -
44
-
45
-
46
-
47
-
48
-
49
-
50
-
51
-
52
-
53
-
54
-
55
-
56
-
57
-
58
-
59
-
60
-
61
-
62
-
63
-
64
-
65
-
66
-
67
-
68
-
69
-
70
-
71
-
72
-
73
-
74
-
75
-
76
-
77
-
78
-
79
-
80
-
81
-
82
-
83
-
84
-
85
-
86
-
87
-
88
-
89
-
90
-
91
-
92
 |
 |

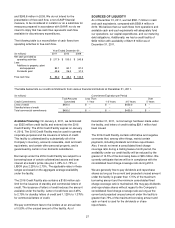
25
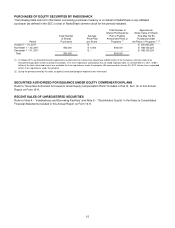
• The wireless service provider agreed to pay $141
million to the Company on or before July 30, 2010.
• The Company and the wireless service provider
agreed to enter into good faith negotiations in the
third quarter of 2010 to modify the commission and
chargeback provisions of our wireless reseller
agreement.
• Beginning July 1, 2010, the wireless service provider
was no longer obligated to pay future residual
revenue amounts to the Company for a period of
time for customers activated on or before June 30,
2010. For the first six months of 2010, these residual
revenue amounts averaged approximately $9 million
per quarter. Based on this average, we would
receive no residual revenue payments from this
wireless service provider for eight quarters beginning
with the third quarter of 2010 under the terms of the
settlement agreement.
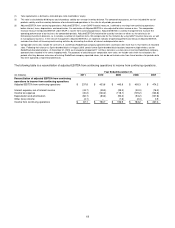
The effects of the settlement agreement have been
reflected in net sales and operating revenues in the
consolidated financial statements for 2010.
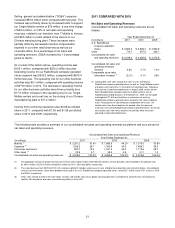
Net Sales and Operating Revenues
Consolidated net sales increased 4.7% or $192.2 million to
$4,265.8 million for the year ended December 31, 2010,
compared with $4,073.6 million in 2009. This increase was
primarily due to a comparable store sales increase of 4.1%
in 2010. The increase in comparable store sales was driven
primarily by increased sales in our mobility platform, which
was partially offset by decreased sales in our signature and
consumer electronics platforms.
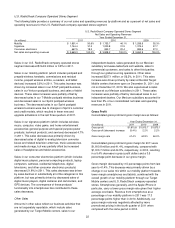
U.S. RadioShack Company-Operated Stores Segment
Sales in our U.S. RadioShack company-operated stores
segment increased $157.3 million or 4.3% in 2010.
Sales in our mobility platform increased 36.0% in 2010.
This sales increase was driven by increased sales in our
Sprint and AT&T postpaid wireless business and increased
sales of prepaid wireless handsets and airtime. The
inclusion of T-Mobile as a postpaid wireless carrier
increased sales for the first nine months of 2010; however,
T-Mobile sales decreased in the fourth quarter, when
compared to the same period in 2009.
Sales in our signature platform decreased 12.7% in 2010.
This sales decrease was primarily driven by decreased
sales of digital-to-analog television converter boxes and
television antennas as well as general and special purpose
batteries, which were partially offset by increased sales of
wireless accessories. Consolidated sales of converter
boxes were $33.7 million and $170.1 million in 2010 and
2009, respectively. Converter box sales have decreased
since the transition to digital television occurred in June
2009.
Sales in our consumer electronics platform decreased
13.4% in 2010. This decrease was driven primarily by
decreased sales of digital televisions, GPS devices, digital
cameras and camcorders, and digital music players, which
were partially offset by increased sales of laptops.
Other Sales
Other sales increased $34.9 million or 8.3% in 2010. This
sales increase was driven primarily by new sales in our
Target Mobile centers, increased sales at our Mexican
subsidiary, and increased sales to our independent dealers,
which were partially offset by the closure of our Sprint-
branded kiosk business and decreased sales from
www.radioshack.com, our global sourcing business, and
our manufacturing operations. We closed our Sprint-
branded kiosks in the third quarter of 2009. Our Mexican
subsidiary accounted for less than 5% of our consolidated
net sales and operating revenues in 2010.
Gross Profit
Consolidated gross profit and gross margin for 2010 were
$1,913.7 million and 44.9%, respectively, compared with
$1,873.1 million and 46.0%, respectively, in 2009, resulting
in a 2.2% increase in gross profit dollars and a 110 basis
point decrease in our gross margin.
The increase in gross profit dollars was primarily due to
increased sales, but was partially offset by decreased gross
margin. Gross margin declined primarily due to a higher
sales mix of lower margin wireless handsets and
incremental promotional and clearance markdowns
associated with seasonal sell-through and product
transitions in non-wireless platforms.
Selling, General and Administrative Expense
Our consolidated SG&A expense increased 3.4% or $48.8
million in 2010. This represents a 40 basis point decrease
as a percentage of net sales and operating revenues
compared to 2009.
Compensation expense increased in dollars and as a
percentage of net sales and operating revenues. This
increase was driven by incentive compensation paid on
increased wireless sales and the hiring of additional
employees to support our Target Mobile centers.
Advertising expense was higher in 2010 primarily due to
incremental advertising related to brand building in the
second quarter of 2010.
Depreciation and Amortization
Total depreciation and amortization from continuing
operations for 2010 declined $6.9 million or 7.6%. Our
depreciation expense has been trending lower over the
past five years due to our lower level of capital