Radio Shack 2011 Annual Report Download - page 74
Download and view the complete annual report
Please find page 74 of the 2011 Radio Shack annual report below. You can navigate through the pages in the report by either clicking on the pages listed below, or by using the keyword search tool below to find specific information within the annual report.-
 1
1 -
2
-
3
-
4
-
5
-
6
-
7
-
8
-
9
-
10
-
11
-
12
-
13
-
14
-
15
-
16
-
17
-
18
-
19
-
20
-
21
-
22
-
23
-
24
-
25
-
26
-
27
-
28
-
29
-
30
-
31
-
32
-
33
-
34
-
35
-
36
-
37
-
38
-
39
-
40
-
41
-
42
-
43
-
44
-
45
-
46
-
47
-
48
-
49
-
50
-
51
-
52
-
53
-
54
-
55
-
56
-
57
-
58
-
59
-
60
-
61
-
62
-
63
-
 64
64 -
 65
65 -
 66
66 -
 67
67 -
 68
68 -
 69
69 -
 70
70 -
 71
71 -
 72
72 -
 73
73 -
 74
74 -
 75
75 -
 76
76 -
 77
77 -
 78
78 -
 79
79 -
 80
80 -
 81
81 -
 82
82 -
 83
83 -
 84
84 -
85
-
86
-
87
-
88
-
89
-
90
-
91
-
92
 |
 |

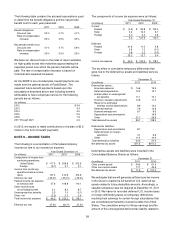
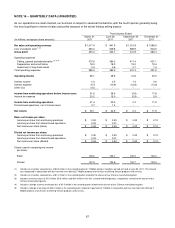
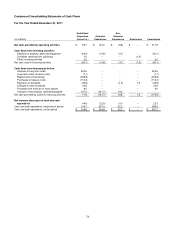
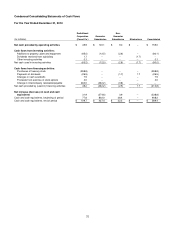
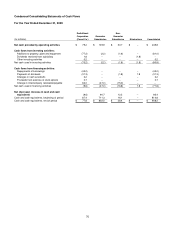
66
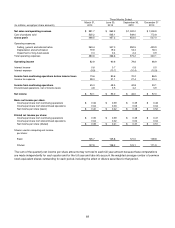
Year Ended December 31,
(In millions) 2011 2010 2009
Net sales and operating revenues:
U.S. RadioShack company-operated stores $ 3,663.3 $ 3,808.2 $ 3,650.9
Other 714.7 457.6 422.7
$ 4,378.0 $ 4,265.8 $ 4,073.6
Operating income:
U.S. RadioShack company-operated stores
(
1
)
$ 530.2 $ 675.4 $ 702.8
Other
(
2
)
(
3
)
(0.1) 37.8 41.4
530.1 713.2 744.2
Unallocated
(
4
)
(375.0) (363.0) (388.7)
Operating income 155.1 350.2 355.5
Interest income 3.1 2.6 4.8
Interest expense (46.8) (41.9) (44.1)
Other loss (4.1) -- (1.6)
Income from continuing operations before income taxes $ 107.3 $ 310.9 $ 314.6
Depreciation and amortization:
U.S. RadioShack company-operated stores $ 37.9 $ 45.4 $ 45.8
Other 8.7 5.2 6.4
46.6 50.6 52.2
Unallocated
(
5
)
36.1 32.8 38.1
Depreciation and amortization from continuing operations 82.7 83.4 90.3
Depreciation and amortization from discontinued operations 0.4 0.8 2.6
$ 83.1 $ 84.2 $ 92.9
(1) Includes a charge to earnings of $23.4 million for 2011 related to a payment to T-Mobile in conjunction with our transition from offering T-Mobile products
and services to offering Verizon products and services.
(2) Includes a loss on the closing of our Chinese manufacturing plant of $11.4 million in 2011.
(3) Operating loss for our Target Mobile centers increased by $17.0 million from 2010 to 2011 and increased by $4.9 million from 2009 to 2010.
(4) The unallocated category included in operating income relates to our overhead and corporate expenses that are not allocated to our operating segments for
management reporting purposes. Unallocated costs include corporate departmental expenses such as labor and benefits, as well as advertising, insurance,
distribution and information technology costs plus certain unusual or infrequent gains or losses.
(5) Depreciation and amortization included in the unallocated category primarily relate to our information technology assets.
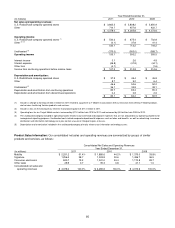
Product Sales Information: Our consolidated net sales and operating revenues are summarized by groups of similar
products and services, as follows:
Consolidated Net Sales and Operating Revenues
Year Ended December 31,
(In millions) 2011 2010 2009
Mobility $ 2,251.2 51.4% $ 1,885.6 44.2% $ 1,375.0 33.8%
Signature 1,256.2 28.7 1,303.9 30.6 1,486.7 36.5
Consumer electronics 840.7 19.2 1,041.0 24.4 1,170.8 28.7
Other sales 29.9 0.7 35.3 0.8 41.1 1.0
Consolidated net sales and
operating revenues
$ 4,378.0
100.0%
$ 4,265.8
100.0%
$ 4,073.6
100.0%