Radio Shack 2011 Annual Report Download - page 24
Download and view the complete annual report
Please find page 24 of the 2011 Radio Shack annual report below. You can navigate through the pages in the report by either clicking on the pages listed below, or by using the keyword search tool below to find specific information within the annual report.-
 1
1 -
2
-
3
-
4
-
5
-
6
-
7
-
8
-
9
-
10
-
11
-
12
-
13
-
 14
14 -
 15
15 -
 16
16 -
 17
17 -
 18
18 -
 19
19 -
 20
20 -
 21
21 -
 22
22 -
 23
23 -
 24
24 -
 25
25 -
 26
26 -
 27
27 -
 28
28 -
 29
29 -
 30
30 -
 31
31 -
 32
32 -
 33
33 -
 34
34 -
35
-
36
-
37
-
38
-
39
-
40
-
41
-
42
-
43
-
44
-
45
-
46
-
47
-
48
-
49
-
50
-
51
-
52
-
53
-
54
-
55
-
56
-
57
-
58
-
59
-
60
-
61
-
62
-
63
-
64
-
65
-
66
-
67
-
68
-
69
-
70
-
71
-
72
-
73
-
74
-
75
-
76
-
77
-
78
-
79
-
80
-
81
-
82
-
83
-
84
-
85
-
86
-
87
-
88
-
89
-
90
-
91
-
92
 |
 |
16
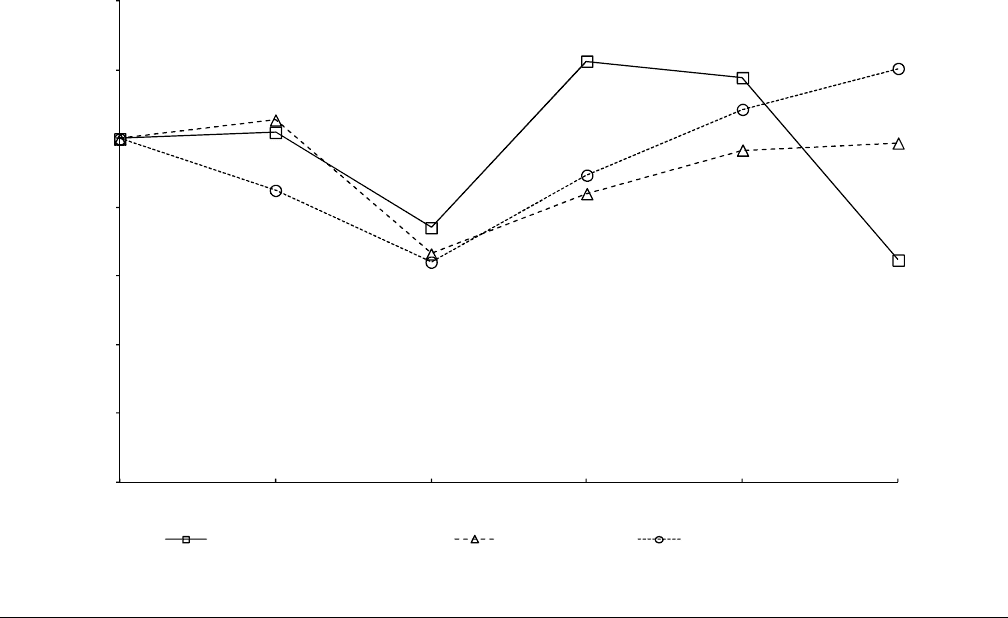
RADIOSHACK STOCK COMPARATIVE PERFORMANCE GRAPH
The following stock performance graph and related information shall not be deemed “soliciting material” or “filed” with the SEC,
nor shall such information be incorporated by reference into any of our future filings under the Securities Act of 1933, as
amended, or the Exchange Act, except to the extent that we specifically incorporate it by reference in the filing.
The graph below compares the cumulative total shareholder return on RadioShack common stock for the last five years with
the cumulative total return on the Standard & Poor's 500 Index and the Standard & Poor's Specialty Retail Index. The S&P
Specialty Retail Index is a capitalization-weighted index of domestic equities traded on the NYSE and NASDAQ, and includes
high-capitalization stocks representing the specialty retail sector of the S&P 500. The graph assumes an investment of $100 at
the close of trading on December 31, 2006, in RadioShack common stock, the S&P 500 Index and the S&P Specialty Retail
Index.
12/06 12/07 12/08 12/09 12/10 12/11
RadioShack Corporation $ 100.00 $ 101.87 $ 74.08 $ 122.63 $ 117.81 $ 64.67
S&P 500 Index 100.00 105.49 66.46 84.05 96.71 98.75
S&P Specialty Retail Index 100.00 84.99 64.09 89.41 108.57 120.50
* Cumulative Total Return assumes dividend reinvestment.
Information Source: Standard & Poor's, a division of The McGraw-Hill Companies Inc.
$0
$20
$40
$60
$80
$100
$120
$140
12/06
12/07
12/08
12/09
12/10
12/11
COMPARISON OF 5 YEAR CUMULATIVE TOTAL RETURN*
Among RadioShack Corporation, the S&P 500 Index,
and S&P Specialty Retail Index
RadioShack Corporation S&P 500 S&P Specialty Retail