Radio Shack 2011 Annual Report Download - page 36
Download and view the complete annual report
Please find page 36 of the 2011 Radio Shack annual report below. You can navigate through the pages in the report by either clicking on the pages listed below, or by using the keyword search tool below to find specific information within the annual report.-
 1
1 -
2
-
3
-
4
-
5
-
6
-
7
-
8
-
9
-
10
-
11
-
12
-
13
-
14
-
15
-
16
-
17
-
18
-
19
-
20
-
21
-
22
-
23
-
24
-
25
-
 26
26 -
 27
27 -
 28
28 -
 29
29 -
 30
30 -
 31
31 -
 32
32 -
 33
33 -
 34
34 -
 35
35 -
 36
36 -
 37
37 -
 38
38 -
 39
39 -
 40
40 -
 41
41 -
 42
42 -
 43
43 -
 44
44 -
 45
45 -
 46
46 -
47
-
48
-
49
-
50
-
51
-
52
-
53
-
54
-
55
-
56
-
57
-
58
-
59
-
60
-
61
-
62
-
63
-
64
-
65
-
66
-
67
-
68
-
69
-
70
-
71
-
72
-
73
-
74
-
75
-
76
-
77
-
78
-
79
-
80
-
81
-
82
-
83
-
84
-
85
-
86
-
87
-
88
-
89
-
90
-
91
-
92
 |
 |

28
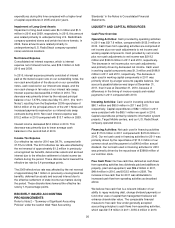
CASH REQUIREMENTS
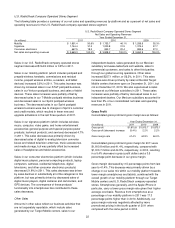
Capital Expenditures: We anticipate that our capital
expenditure requirements for 2012 will range from $70
million to $90 million. The nature of our capital expenditures
is comprised of a base level of investment required to
support our current operations and a discretionary amount
related to our strategic initiatives. The base level of capital
expenditures required to support our operations ranges
from $40 million to $50 million. The remaining amount of
anticipated capital expenditures relates to strategic
initiatives as reflected in our annual plan. These capital
expenditures are discretionary and, therefore, may not be
spent if we decide not to pursue one or more of our
strategic initiatives. U.S. RadioShack company-operated
store remodels and relocations and information systems
projects will account for the majority of our anticipated 2012
capital expenditures. Cash and cash equivalents and cash
generated from operating activities will be used to fund
future capital expenditure needs.
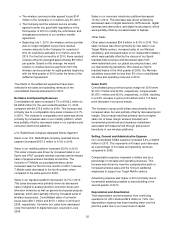
Seasonal Inventory Buildup: Typically, our annual cash
requirements for pre-seasonal inventory buildup from
August to November range between $150 million and $250
million. The funding required for this buildup comes
primarily from cash on hand and cash generated from net
sales and operating revenues. Additionally, our 2016 Credit
Facility could be utilized to fund the inventory buildup.
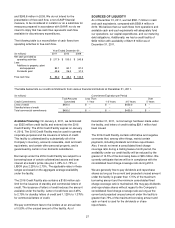
Contractual Obligations
The table below contains our known contractual commitments as of December 31, 2011.
(In millions) Payments Due by Period
Contractual Obligations
Total
Less Than
1 Year
1-3 Years
3-5 Years
More than
5 Years
Long-term debt obligations
(1)
$ 701.0
$ --
$ 376.0
$ --
$ 325.0
Interest obligations 175.9
31.4
49.4
43.9
51.2
Operating lease obligations
(2)
577.5
195.2
241.8
108.2
32.3
Purchase obligations
(3)
333.2
316.0
15.2
2.0
--
Other long-term liabilities reflected on the balance sheet
(4)
87.6
24.0
4.8
25.2
Total $ 1,875.2
$ 542.6
$ 706.4
$ 158.9
$ 433.7
(1) For more information regarding long-term debt, refer to Note 4 – “Indebtedness and Borrowing Facilities” of our Notes to Consolidated Financial Statements
included elsewhere in this Annual Report on Form 10-K.
(2) For more information regarding lease commitments, refer to Note 13 – “Commitments and Contingencies” of our Notes to Consolidated Financial Statements
included elsewhere in this Annual Report on Form 10-K.
(3) Purchase obligations primarily include our product commitments and marketing agreements.
(4) Includes a $33.6 million liability for unrecognized tax benefits and related accrued interest. We are not able to reasonably estimate the timing of the payments or
the amount by which the liability will increase or decrease over time; therefore, the related balances have not been reflected in the ‘‘Payments Due by Period’’
section of the table.