Pentax 2007 Annual Report Download - page 70
Download and view the complete annual report
Please find page 70 of the 2007 Pentax annual report below. You can navigate through the pages in the report by either clicking on the pages listed below, or by using the keyword search tool below to find specific information within the annual report.-
 1
1 -
2
-
3
-
4
-
5
-
6
-
7
-
8
-
9
-
10
-
11
-
12
-
13
-
14
-
15
-
16
-
17
-
18
-
19
-
20
-
21
-
22
-
23
-
24
-
25
-
26
-
27
-
28
-
29
-
30
-
31
-
32
-
33
-
34
-
35
-
36
-
37
-
38
-
39
-
40
-
41
-
42
-
43
-
44
-
45
-
46
-
47
-
48
-
49
-
50
-
51
-
52
-
53
-
54
-
55
-
56
-
57
-
58
-
59
-
 60
60 -
 61
61 -
 62
62 -
 63
63 -
 64
64 -
 65
65 -
 66
66 -
 67
67 -
 68
68 -
 69
69 -
 70
70 -
 71
71 -
 72
72 -
 73
73 -
 74
74 -
 75
75 -
 76
76 -
 77
77 -
 78
78
 |
 |

68
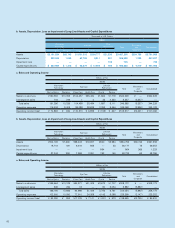
Millions of Yen
2006
Japan North
America Europe Asia Total Eliminations
and Corporate Consolidated
Sales to customers ¥244,998 ¥35,471 ¥39,232 ¥ 24,527 ¥344,228 ¥ — ¥344,228
Interarea transfers 23,901 222 683 120,813 145,619 (145,619) —
Total sales 268,899 35,693 39,915 145,340 489,847 (145,619) 344,228
Operating expenses 230,414 34,606 33,367 97,226 395,613 (152,481) 243,132
Operating income ¥ 38,485 ¥ 1,087 ¥ 6,548 ¥ 48,114 ¥ 94,234 ¥ 6,862 ¥101,096
Assets ¥163,840 ¥22,377 ¥63,346 ¥149,299 ¥398,862 ¥ (37,324) ¥361,538
Millions of Yen
2005
Japan North
America Europe Asia Total Eliminations
and Corporate Consolidated
Sales to customers ¥230,946 ¥30,775 ¥33,803 ¥ 12,648 ¥308,172 ¥ — ¥308,172
Interarea transfers 19,048 200 255 89,749 109,252 (109,252) —
Total sales 249,994 30,975 34,058 102,397 417,424 (109,252) 308,172
Operating expenses 204,413 30,912 28,195 71,004 334,524 (111,272) 223,252
Operating income ¥ 45,581 ¥ 63 ¥ 5,863 ¥ 31,393 ¥ 82,900 ¥ 2,020 ¥ 84,920
Assets ¥165,938 ¥17,129 ¥32,927 ¥104,191 ¥320,185 ¥ 31,297 ¥351,482
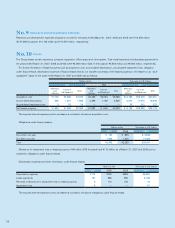
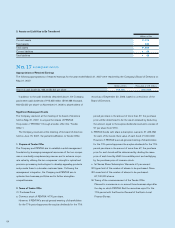
Notes: 1. The Company and subsidiaries are summarized in four segments by geographic area based on the countries where the Group is located. The segments consist
of the following countries:
North America: United States of America, Canada, etc.
Europe: Netherlands, Germany, United Kingdom, etc. (including South Africa)
Asia: Singapore, Thailand, China, Republic of Korea, Taiwan, etc. (including Australia)
2. Corporate operating expenses consist primarily of the administration expenses of the Company, which are not allocated to segments by geographic area.
Corporate operating expenses for the years ended March 31, 2007, 2006 and 2005 were ¥2,993 million ($25,354 thousand), ¥2,317 million and ¥2,562 million,
respectively.
3. Corporate assets consist primarily of cash, time deposits, investment securities and administrative assets of the Company. Corporate assets as of March 31,
2007, 2006 and 2005 were ¥59,047 million ($500,186 thousand), ¥33,959 million and ¥72,841 million, respectively.
4. Consolidated operating expenses are equal to the total of cost of sales and selling, general and administrative expenses shown in the accompanying
consolidated statements of income.
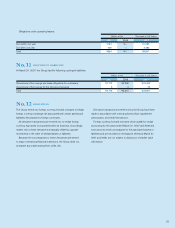
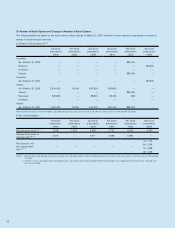
(3) Sales to Foreign Customers
The sales to foreign customers of the Company and subsidiaries for the years ended March 31, 2007, 2006 and 2005 are summarized as
follows:
Millions of Yen
2007
North America Europe Asia Other Total
Overseas sales (A) ¥44,954 ¥53,524 ¥113,060 ¥8 ¥211,546
Consolidated sales (B) 390,093
(A)/(B) 11.5% 13.7% 29.0% 0.0% 54.2%
Thousands of U.S. Dollars
2007
North America Europe Asia Other Total
Overseas sales (A) $380,805 $453,401 $957,730 $67 $1,792,003
Consolidated sales (B) 3,304,473