Pentax 2007 Annual Report Download - page 40
Download and view the complete annual report
Please find page 40 of the 2007 Pentax annual report below. You can navigate through the pages in the report by either clicking on the pages listed below, or by using the keyword search tool below to find specific information within the annual report.-
 1
1 -
2
-
3
-
4
-
5
-
6
-
7
-
8
-
9
-
10
-
11
-
12
-
13
-
14
-
15
-
16
-
17
-
18
-
19
-
20
-
21
-
22
-
23
-
24
-
25
-
26
-
27
-
28
-
29
-
 30
30 -
 31
31 -
 32
32 -
 33
33 -
 34
34 -
 35
35 -
 36
36 -
 37
37 -
 38
38 -
 39
39 -
 40
40 -
 41
41 -
 42
42 -
 43
43 -
 44
44 -
 45
45 -
 46
46 -
 47
47 -
 48
48 -
 49
49 -
 50
50 -
51
-
52
-
53
-
54
-
55
-
56
-
57
-
58
-
59
-
60
-
61
-
62
-
63
-
64
-
65
-
66
-
67
-
68
-
69
-
70
-
71
-
72
-
73
-
74
-
75
-
76
-
77
-
78
 |
 |
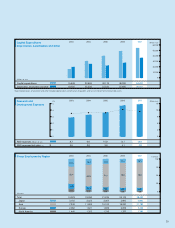
The Crystal and Services businesses used to be presented
separately as individual divisions. However, shrinking sales and
operating income brought about by restructuring has reduced the
importance of separate presentation, and from the fiscal year ended
March 31, 2007, these businesses are presented together as
“Other Businesses.”
The Crystal business has been reduced in scale through
restructuring, but is currently continuing to pioneer new markets and
38
Segment Overview
Other Businesses
100
75
50
25
0
2003 2004 2005 2006
2007
14
,
023
3
,
150
7
,
346
2
,
082
1
,
445
18
,
092
3
,
023
11
,
925
1
,
821
1
,
323
21
,
234
3
,
007
15
,
102
1
,
809
1
,
316
25
,
176
2
,
800
19
,
030
2
,
009
1
,
337
28,450
2,861
21,780
2,429
1,380
(%)
5
4
3
2
1
0
2003 2004 2005 2006
2007
60
,
000
50
,
000
40
,
000
30
,
000
20
,
000
10
,
000
0
2003 2004 2005 2006
2007
15
,
948
19
,
792
30
,
659
25
,
328
40
,
175
22
,
520
48
,
786
27
,
485
54,432
36,427
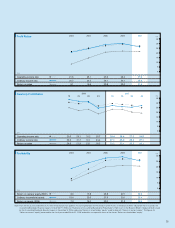
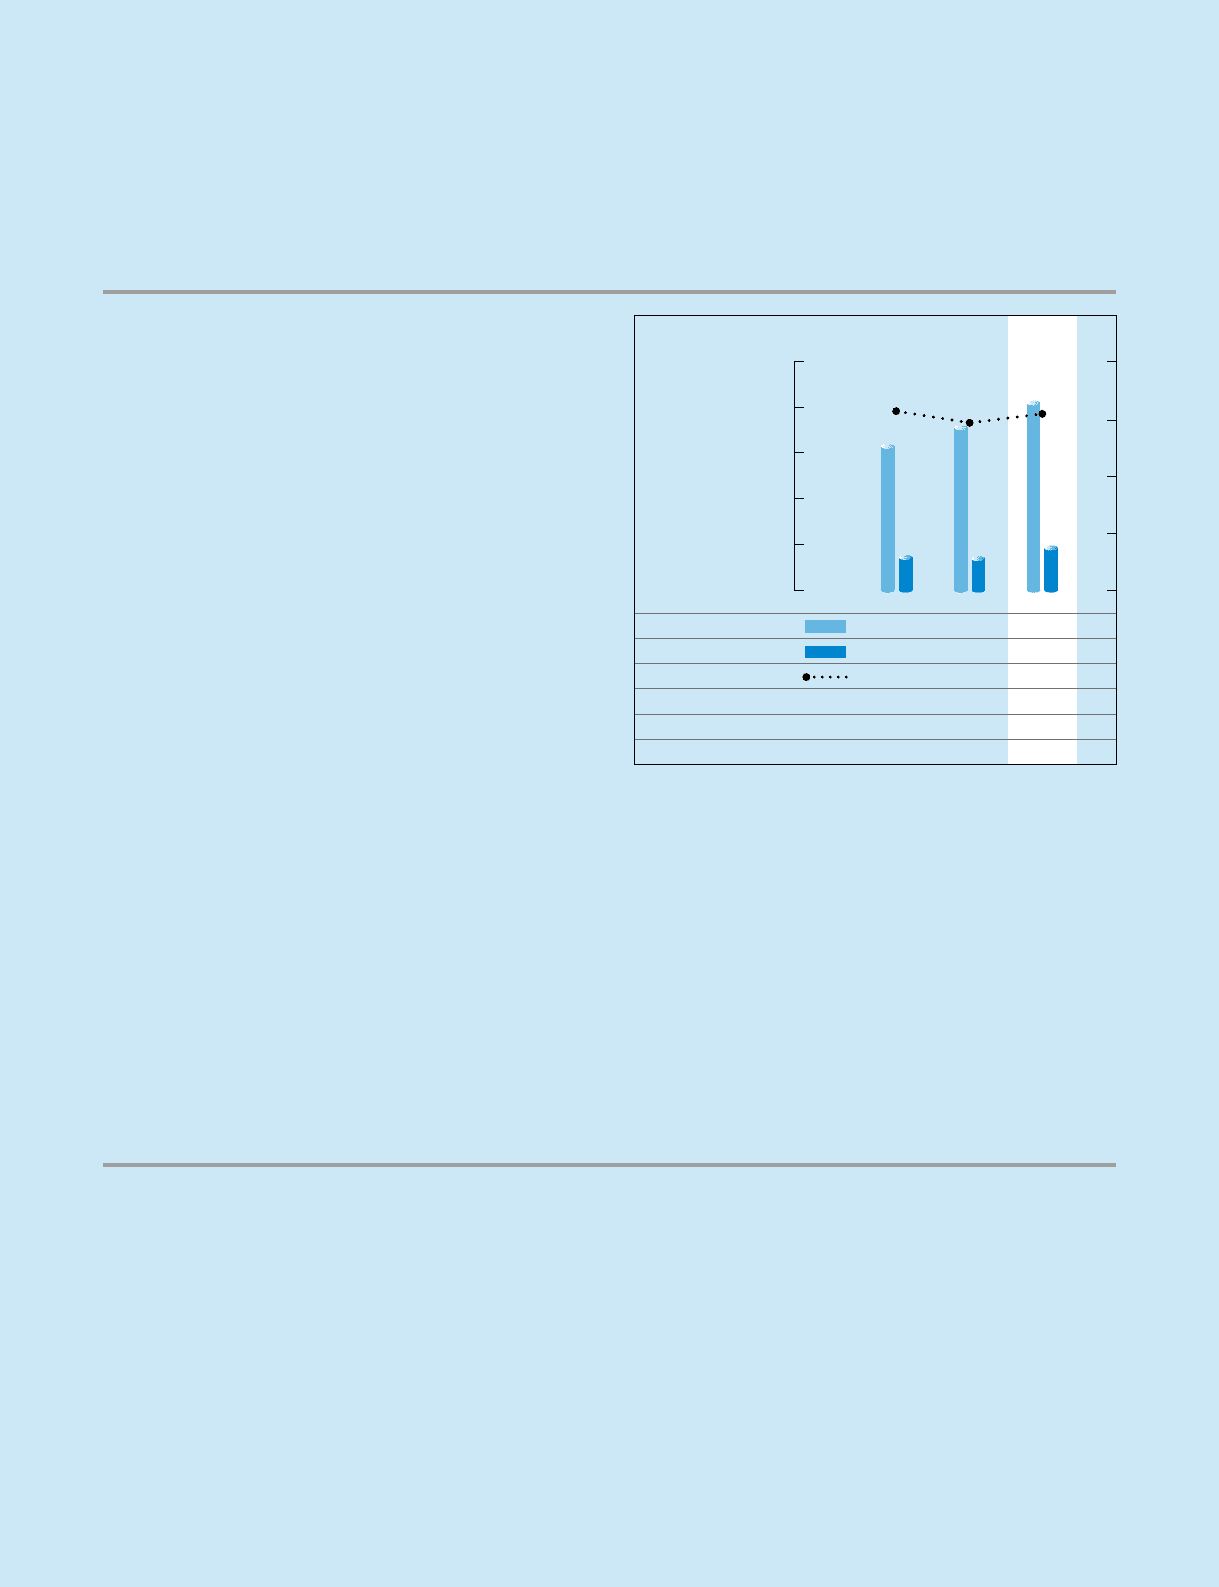
Net sales for the Health Care division grew 15.1% year on year to
¥40,850 million. In contact lenses, amid sweeping changes in the
market following revision of the remuneration system for medical
services, Hoya achieved revenue growth through continued opening
of new locations of directly managed Eye City stores, along with
customer appreciation of high-quality service. In intraocular lenses
(IOLs) used for surgical treatment of cataracts, sales rose both in
Japan and overseas as a result of Hoya’s growing share of the
domestic market, where high-quality products are valued, along with
steadily growing visibility in overseas markets.
Operating income for the Health Care division increased 34.3%
to ¥9,215 million, with an operating income ratio of 22.6%, 3.3
percentage points higher than in the previous fiscal year. During the
previous fiscal year, the Company changed the method of
accounting for expenses related to the points awarded to
customers for product purchases at Eye City, resulting in a full
year’s worth of point system expenses being recorded as a lump
sum in the fourth quarter of that fiscal year, which provided a
significant boost to earnings. By quarter, the operating income
margin was 21.7% in the first quarter, 23.3% in the second quarter,
20.5% in the third quarter and 24.6% in the fourth quarter.
In the segment graph on page 36, as a result of improvement in
both net sales growth rate and the profit margin, the circle shifted
upward and to the right.
Capital expenditures in the Health Care division decreased
11.4% to ¥2,119 million. Although the Company shifted IOL
production plants overseas and made other expenditures, the
decline arose from a temporary R&D investment generated in the
previous fiscal year.
Eye Care (Health Care Division)
(%)
40
20
0
(Millions of yen)
50
,
000
40
,
000
30
,
000
20
,
000
10
,
000
0
2005 2006
2007
Net sales (Millions of yen)
Operating income (Millions of yen)
Operating income ratio* (%)
Assets (Millions of yen)
Depreciation (Millions of yen)
Capital expenditures (Millions of yen)
31
,
409
7
,
141
22
.
7
18
,
330
669
738
35
,
484
6
,
859
19
.
3
19
,
927
855
2
,
391
40,850
9,215
22.6
24,410
1,170
2,119
* The operating income ratio above is calculated using net sales plus intersegment
sales. Please refer to details on page 65, Segment Information.
22
.
5
52
.
4
14
.
8
16
.
7
65
.
9
10
.
1
14
.
2
71
.
1
8
.
5
11
.
1
75
.
6
8
.
0
10
.
37
.
36
.
25
.
3
10
.
1
76
.
6
8
.
5
4
.
9
8
.
7
3
.
5
9
.
8
3
.
6
10
.
9
3
.
6
14
.
1
4
.
1
14.9
3.8
develop unique products by adhering to a concept unlike that
followed previously. The Services business provides IT systems,
outsourcing and other services to Hoya Group companies. The
division’s temporary staffing business was sold on March 1, 2006,
which resulted in the decline in both revenue and earnings of the
“Other Businesses.”
15
12
9
6
3
0