Pentax 2007 Annual Report Download - page 42
Download and view the complete annual report
Please find page 42 of the 2007 Pentax annual report below. You can navigate through the pages in the report by either clicking on the pages listed below, or by using the keyword search tool below to find specific information within the annual report.-
 1
1 -
2
-
3
-
4
-
5
-
6
-
7
-
8
-
9
-
10
-
11
-
12
-
13
-
14
-
15
-
16
-
17
-
18
-
19
-
20
-
21
-
22
-
23
-
24
-
25
-
26
-
27
-
28
-
29
-
30
-
31
-
 32
32 -
 33
33 -
 34
34 -
 35
35 -
 36
36 -
 37
37 -
 38
38 -
 39
39 -
 40
40 -
 41
41 -
 42
42 -
 43
43 -
 44
44 -
 45
45 -
 46
46 -
 47
47 -
 48
48 -
 49
49 -
 50
50 -
 51
51 -
 52
52 -
53
-
54
-
55
-
56
-
57
-
58
-
59
-
60
-
61
-
62
-
63
-
64
-
65
-
66
-
67
-
68
-
69
-
70
-
71
-
72
-
73
-
74
-
75
-
76
-
77
-
78
 |
 |
40
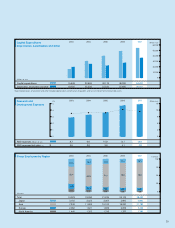
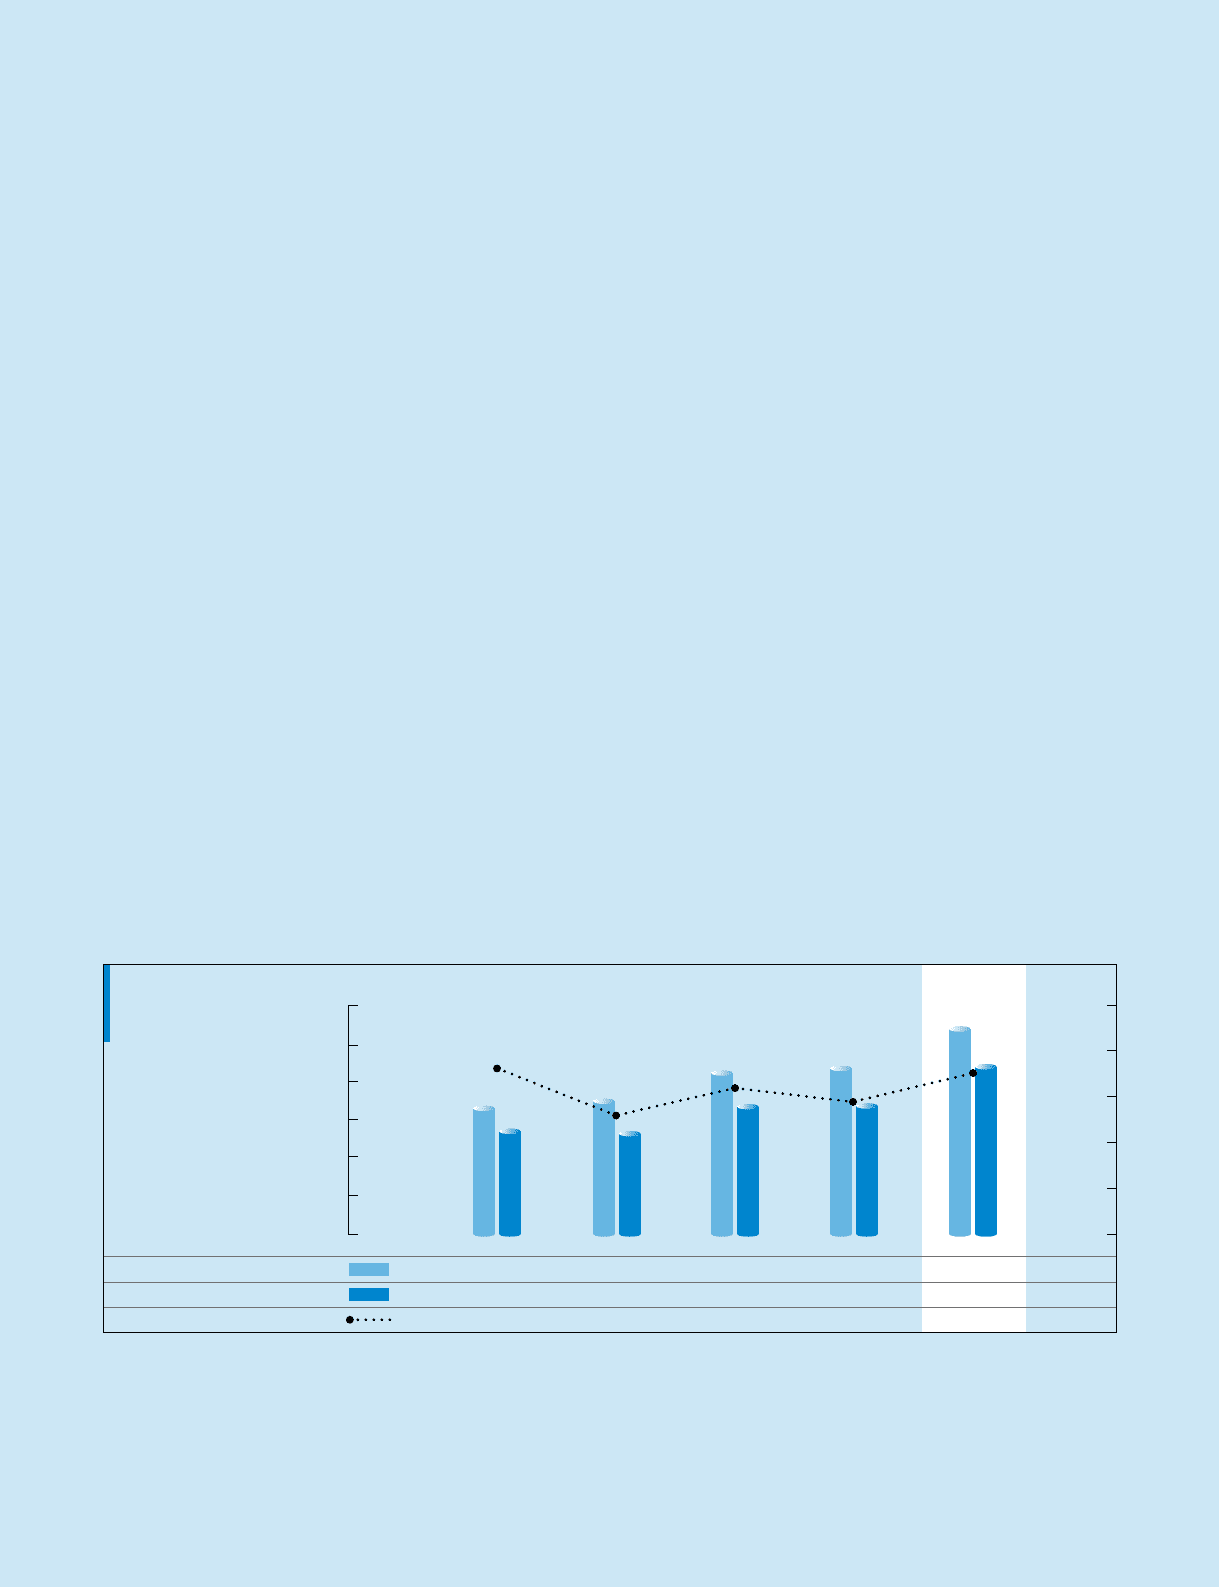
Total Assets,
Owners’ Equity and
Owners’ Equity Ratio
(Millions of yen)
500
,
000
400
,
000
300
,
000
200
,
000
100
,
000
0
(%)
90
85
80
75
70
65
60
2003 2004 2005 2006
2007
120
,
000
100
,
000
80
,
000
60
,
000
40
,
000
20
,
000
0
2003 2004 2005 2006
2007
50
,
000
40
,
000
30
,
000
20
,
000
10
,
000
0
1
Q
2
Q
3
Q
2006
4
Q1Q 2Q 3Q
2007
4Q
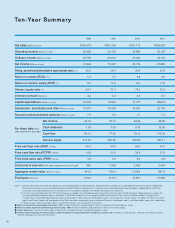
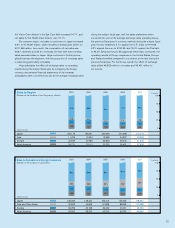
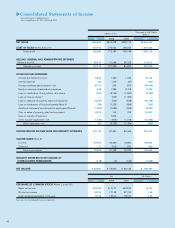
Financial Position
In terms of assets, current assets increased by 29.9% from the end
of the previous fiscal year to ¥275,707 million. The main factors for
this, following the increases in revenue and earnings, were a 44.3%
increase in cash and deposits to ¥120,622 million, a 20.3% rise in
notes and accounts receivable—trade to ¥94,297 million, and a
20.7% increase in inventories to ¥49,722 million. The rate of growth
in cash and deposits was particularly high owing to a decline in
expenditures for acquisition of treasury stock, from ¥64,032 million
in the previous fiscal year to ¥13 million during the subject fiscal
year. Total property, plant and equipment increased 18.8% year on
year to ¥143,218 million, total investment and other assets rose
0.2% to ¥28,719 million, and total noncurrent assets expanded
15.3% to ¥171,938 million. As a result, total assets at the end of the
subject fiscal year amounted to ¥447,644 million, an increase of
23.8% from the end of the previous fiscal year.
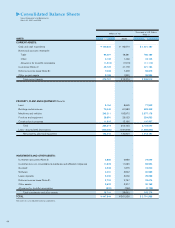
In terms of liabilities, notes and accounts payable—trade
decreased 1.2% to ¥27,733 million, while income tax payable
declined 10.6% to ¥12,821 million, with total current liabilities
decreasing 1.4% from the end of the previous fiscal year to ¥78,181
million. Noncurrent liabilities increased 26.5% from the end of the
previous fiscal year to ¥2,318 million. As a result, total liabilities at
the end of the subject fiscal year amounted to ¥80,499 million, a
decrease of 0.8% from the end of the previous fiscal year.
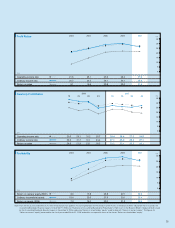
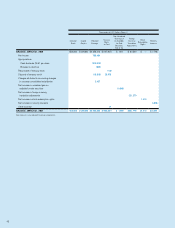
In terms of net assets, retained earnings rose ¥56,167 million, or
21.1%, year on year to ¥322,513 million as a result of an increase in
net income to ¥83,391 million, against ¥25,843 million in dividends
paid, and a decline in other components totaling ¥1,381 million.
Treasury stock declined ¥3,528 million. Consequently, total
shareholders’ equity amounted to ¥331,924 million. Translation
adjustments were ¥33,264 million, up ¥26,122 million year on year.
As a result, total accumulated gains (losses) from revaluation and
translation adjustments amounted to ¥33,178 million. Total net
assets were ¥367,145 million.
Also, from the fiscal year ended March 31, 2007, in accordance
with the “Accounting Standard for Presentation of Net Assets in the
Balance Sheet” (Statement No.5 issued by the Accounting
Standards Board of Japan on December 9, 2005) and “Guidance on
Accounting Standard for Presentation of Net Assets in the Balance
Sheet” (Guidance No.8 issued by the Accounting Standards Board
of Japan on December 9, 2005), the “Shareholders’ equity” section
has been replaced by a “Net assets” section, to which
“Accumulated gains (losses) from revaluation and translation
adjustments,” “Stock subscription rights,” and “Minority interests”
have been added to shareholders’ equity. As a replacement for the
former “Shareholders’ equity” the Company uses “Owners’ equity,”
which excludes “Stock subscription rights” and “Minority interests”
from “Net assets.” The ratio of owners’ equity to total assets
(owners’ equity ratio; the former shareholders’ equity ratio) for the
subject fiscal year was 81.6%, a total of 4.3 percentage points
higher than the 77.3% in the previous fiscal year.
274
,
289
224
,
219
81
.
7
289
,
887
218
,
979
75
.
5
351
,
482
277
,
889
79
.
1
361
,
538
279
,
481
77
.
3
447,644
365,102
81.6
20
,
038
38
,
390
39
,
549
78
,
744
64
,
135
76
,
000
75
,
620
105
,
855
83,391
98,793
20
,
389
17
,
759
18
,
596
29
,
802
20
,
120
17
,
025
16
,
515
41
,
269
21,500
14,066
22,899
35,017
19,964
19,950
19,028
29,760
Total assets (Millions of yen)
Owners’ equity (Millions of yen)
Owners’ equity ratio (%)