Pentax 2007 Annual Report Download - page 37
Download and view the complete annual report
Please find page 37 of the 2007 Pentax annual report below. You can navigate through the pages in the report by either clicking on the pages listed below, or by using the keyword search tool below to find specific information within the annual report.-
 1
1 -
2
-
3
-
4
-
5
-
6
-
7
-
8
-
9
-
10
-
11
-
12
-
13
-
14
-
15
-
16
-
17
-
18
-
19
-
20
-
21
-
22
-
23
-
24
-
25
-
26
-
 27
27 -
 28
28 -
 29
29 -
 30
30 -
 31
31 -
 32
32 -
 33
33 -
 34
34 -
 35
35 -
 36
36 -
 37
37 -
 38
38 -
 39
39 -
 40
40 -
 41
41 -
 42
42 -
 43
43 -
 44
44 -
 45
45 -
 46
46 -
 47
47 -
48
-
49
-
50
-
51
-
52
-
53
-
54
-
55
-
56
-
57
-
58
-
59
-
60
-
61
-
62
-
63
-
64
-
65
-
66
-
67
-
68
-
69
-
70
-
71
-
72
-
73
-
74
-
75
-
76
-
77
-
78
 |
 |
35
120
,
000
100
,
000
80
,
000
60
,
000
40
,
000
20
,
000
0
2003 2004 2005 2006
2007
52
,
983
50
,
874
20
,
038
68
,
167
66
,
554
39
,
549
84
,
920
89
,
525
64
,
135
101
,
096
103
,
638
75
,
620
107,213
102,909
83,391
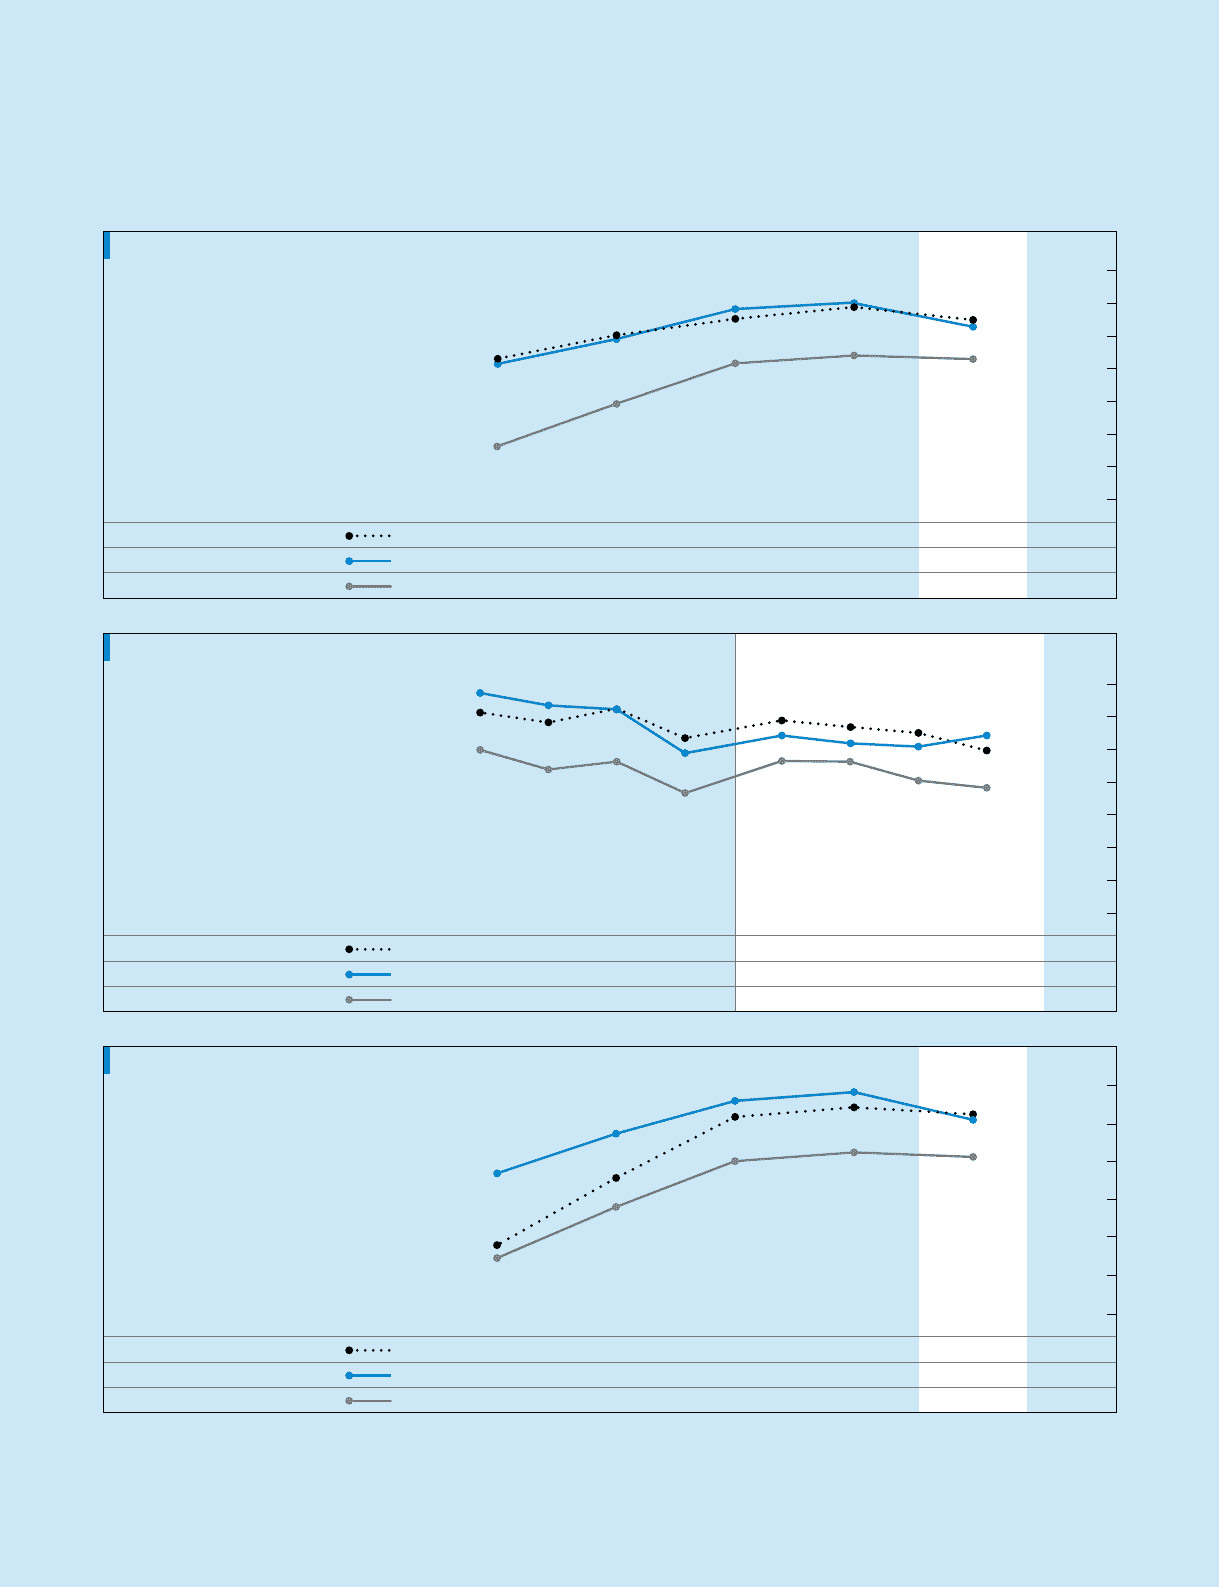
Profit Ratios (%)
35
30
25
20
15
10
5
0
2003 2004 2005 2006
2007
21
.
5
20
.
7
8
.
1
25
.
1
24
.
5
14
.
6
27
.
6
29
.
1
20
.
8
29
.
4
30
.
1
22
.
0
27.5
26.4
21.4
(%)
30
25
20
15
10
5
0
2003 2004 2005 2006
2007
9
.
0
18
.
4
7
.
3
17
.
8
23
.
6
14
.
0
25
.
8
27
.
9
20
.
0
27
.
1
29
.
1
21
.
2
25.9
25.4
20.6
30
,
000
25
,
000
20
,
000
15
,
000
10
,
000
5
,
000
0
1
Q
2
Q
3
Q
2006
4
Q1Q 2Q 3Q
2007
4Q
1
Q
2
Q
3
Q
2006
4
Q1Q 2Q 3Q
2007
4Q
25
,
056
27
,
466
20
,
389
24
,
740
26
,
974
18
,
596
27
,
257
27
,
161
20
,
120
24
,
043
22
,
037
16
,
515
Quarterly Profit Ratios (%)
35
30
25
20
15
10
5
0
30
.
6
33
.
6
24
.
9
29
.
1
31
.
7
21
.
9
31
.
2
31
.
1
23
.
1
26
.
7
24
.
4
18
.
3
29.4
27.1
23.2
28.4
25.9
23.1
27.5
25.4
20.2
24.8
27.1
19.1
(%)
(%)
(%)
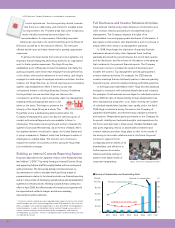
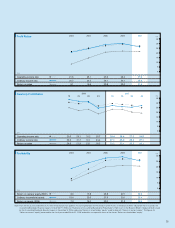
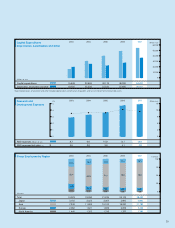
Profitability
Operating income ratio
Ordinary income ratio
Return on sales
Operating income ratio
Ordinary income ratio
Return on sales
Return on owners’ equity (ROE)
Ordinary income/total assets
Return on assets (ROA)
Note: From the fiscal year ended March 31, 2007, the Company has applied “Accounting Standard for Presentation of Net Assets in the Balance Sheet” (Statement No.5 issued by the
Accounting Standards Board of Japan on December 9, 2005) and “Guidance on Accounting Standard for Presentation of Net Assets in the Balance Sheet” (Guidance No.8 issued
by the Accounting Standards Board of Japan on December 9, 2005), replacing “Return on shareholders’ equity” used to date with “Return on owners’ equity.” The figures for
“Return on owners’ equity” presented for the fiscal year ended March 31, 2006 and earlier correspond to those of the former “Return on shareholders’ equity.”
27,241
25,140
21,500
28,125
25,700
22,899
27,216
25,148
19,964
24,631
26,921
19,028