Pentax 2007 Annual Report Download - page 33
Download and view the complete annual report
Please find page 33 of the 2007 Pentax annual report below. You can navigate through the pages in the report by either clicking on the pages listed below, or by using the keyword search tool below to find specific information within the annual report.-
 1
1 -
2
-
3
-
4
-
5
-
6
-
7
-
8
-
9
-
10
-
11
-
12
-
13
-
14
-
15
-
16
-
17
-
18
-
19
-
20
-
21
-
22
-
 23
23 -
 24
24 -
 25
25 -
 26
26 -
 27
27 -
 28
28 -
 29
29 -
 30
30 -
 31
31 -
 32
32 -
 33
33 -
 34
34 -
 35
35 -
 36
36 -
 37
37 -
 38
38 -
 39
39 -
 40
40 -
 41
41 -
 42
42 -
 43
43 -
44
-
45
-
46
-
47
-
48
-
49
-
50
-
51
-
52
-
53
-
54
-
55
-
56
-
57
-
58
-
59
-
60
-
61
-
62
-
63
-
64
-
65
-
66
-
67
-
68
-
69
-
70
-
71
-
72
-
73
-
74
-
75
-
76
-
77
-
78
 |
 |
31
¥235,265
43,898
45,774
23,741
24.2
8.7
11.5
78.8
3.2
19,585
20,105
7.3
50.78
12.50
88.31
471.55
44.5
25.6
4.8
2,260
1,049.8
13,311
¥246,293
52,983
50,874
20,038
24.4
7.3
9.0
81.7
2.9
15,948
19,792
8.7
42.77
12.50
82.72
486.29
41.8
21.6
3.7
1,787
830.3
14,023
¥271,444
68,167
66,554
39,549
22.3
14.0
17.8
75.5
2.8
30,659
25,328
9.8
87.74
25.00
174.91
491.90
28.9
14.5
5.2
2,537
1,178.7
18,092
¥308,172
84,920
89,525
64,135
21.1
20.0
25.8
79.1
2.7
40,175
22,520
10.9
144.71
37.50
171.65
623.59
20.4
17.2
4.7
2,950
1,325.7
21,234
¥344,228
101,096
103,638
75,620
20.7
21.2
27.1
77.3
2.7
48,786
27,485
14.1
171.71
60.00
240.57
648.87
27.7
19.7
7.3
4,750
2,066.3
25,176
¥390,093
107,213
102,909
83,391
21.9
20.6
25.9
81.6
2.8
54,432
36,427
14.9
193.50
65.00
229.23
845.98
20.2
17.1
4.6
3,910
1,700.9
28,450
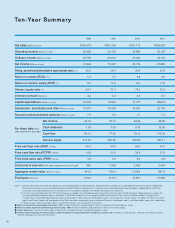
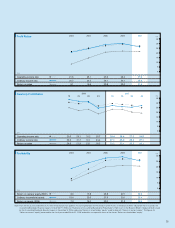
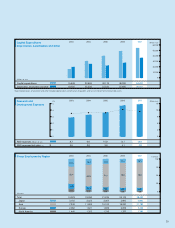
2002 2003 2004 2005 2006 2007
●
●
●
●
● Capital expenditures: Includes property, plant and equipment as well as intangible fixed assets.
● Depreciation, amortization and other: Includes the loss on impairment of long-lived assets and amortization of goodwill.
● Per share data: Per share data has been retroactively adjusted to reflect a four-for-one split of common shares implemented on November 15, 2005.
● Cash flow per share: From fiscal 2002 and after, figures for cash flow per share are shown as cash flow from operating activities divided by the average number of issued shares for the
fiscal period. Figures prior to 2002 are calculated using simple cash flow calculated by adding depreciation and other factors to net income.
● Price earnings ratio (PER; stock price at fiscal year-end/net income per share): An indicator to determine whether a company's share price is relatively high or low in comparison with
its earnings. A company's PER is compared against the market average or that of competitors to determine the standard for the share price and other data.
● Price cash flow ratio (stock price at fiscal year-end/cash flow per share): Cash flow is calculated by adding net income, depreciation, amortization and other. Depreciation indicates active
investment aiming for future growth, so the price cash flow ratio can be used to gauge the price level of a stock by taking into consideration future growth potential. It can be used
together with the price earnings ratio, the market average and comparative ratios for other companies in the same industry to judge whether the Company’s stock price is overvalued or
undervalued.
● Price book value ratio (stock price at fiscal year-end/net assets per share): An index of valuation that compares the Company’s stock price to the value of its net assets. An index of less
than one suggests that dissolving the company and selling off its assets may be more profitable than holding the Company’s stock.