Pentax 2007 Annual Report Download - page 43
Download and view the complete annual report
Please find page 43 of the 2007 Pentax annual report below. You can navigate through the pages in the report by either clicking on the pages listed below, or by using the keyword search tool below to find specific information within the annual report.-
 1
1 -
2
-
3
-
4
-
5
-
6
-
7
-
8
-
9
-
10
-
11
-
12
-
13
-
14
-
15
-
16
-
17
-
18
-
19
-
20
-
21
-
22
-
23
-
24
-
25
-
26
-
27
-
28
-
29
-
30
-
31
-
32
-
 33
33 -
 34
34 -
 35
35 -
 36
36 -
 37
37 -
 38
38 -
 39
39 -
 40
40 -
 41
41 -
 42
42 -
 43
43 -
 44
44 -
 45
45 -
 46
46 -
 47
47 -
 48
48 -
 49
49 -
 50
50 -
 51
51 -
 52
52 -
 53
53 -
54
-
55
-
56
-
57
-
58
-
59
-
60
-
61
-
62
-
63
-
64
-
65
-
66
-
67
-
68
-
69
-
70
-
71
-
72
-
73
-
74
-
75
-
76
-
77
-
78
 |
 |
41
500
,
000
400
,
000
300
,
000
200
,
000
100
,
000
0
90
85
80
75
70
65
60
2003 2004 2005 2006
2007
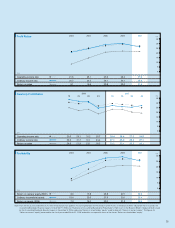
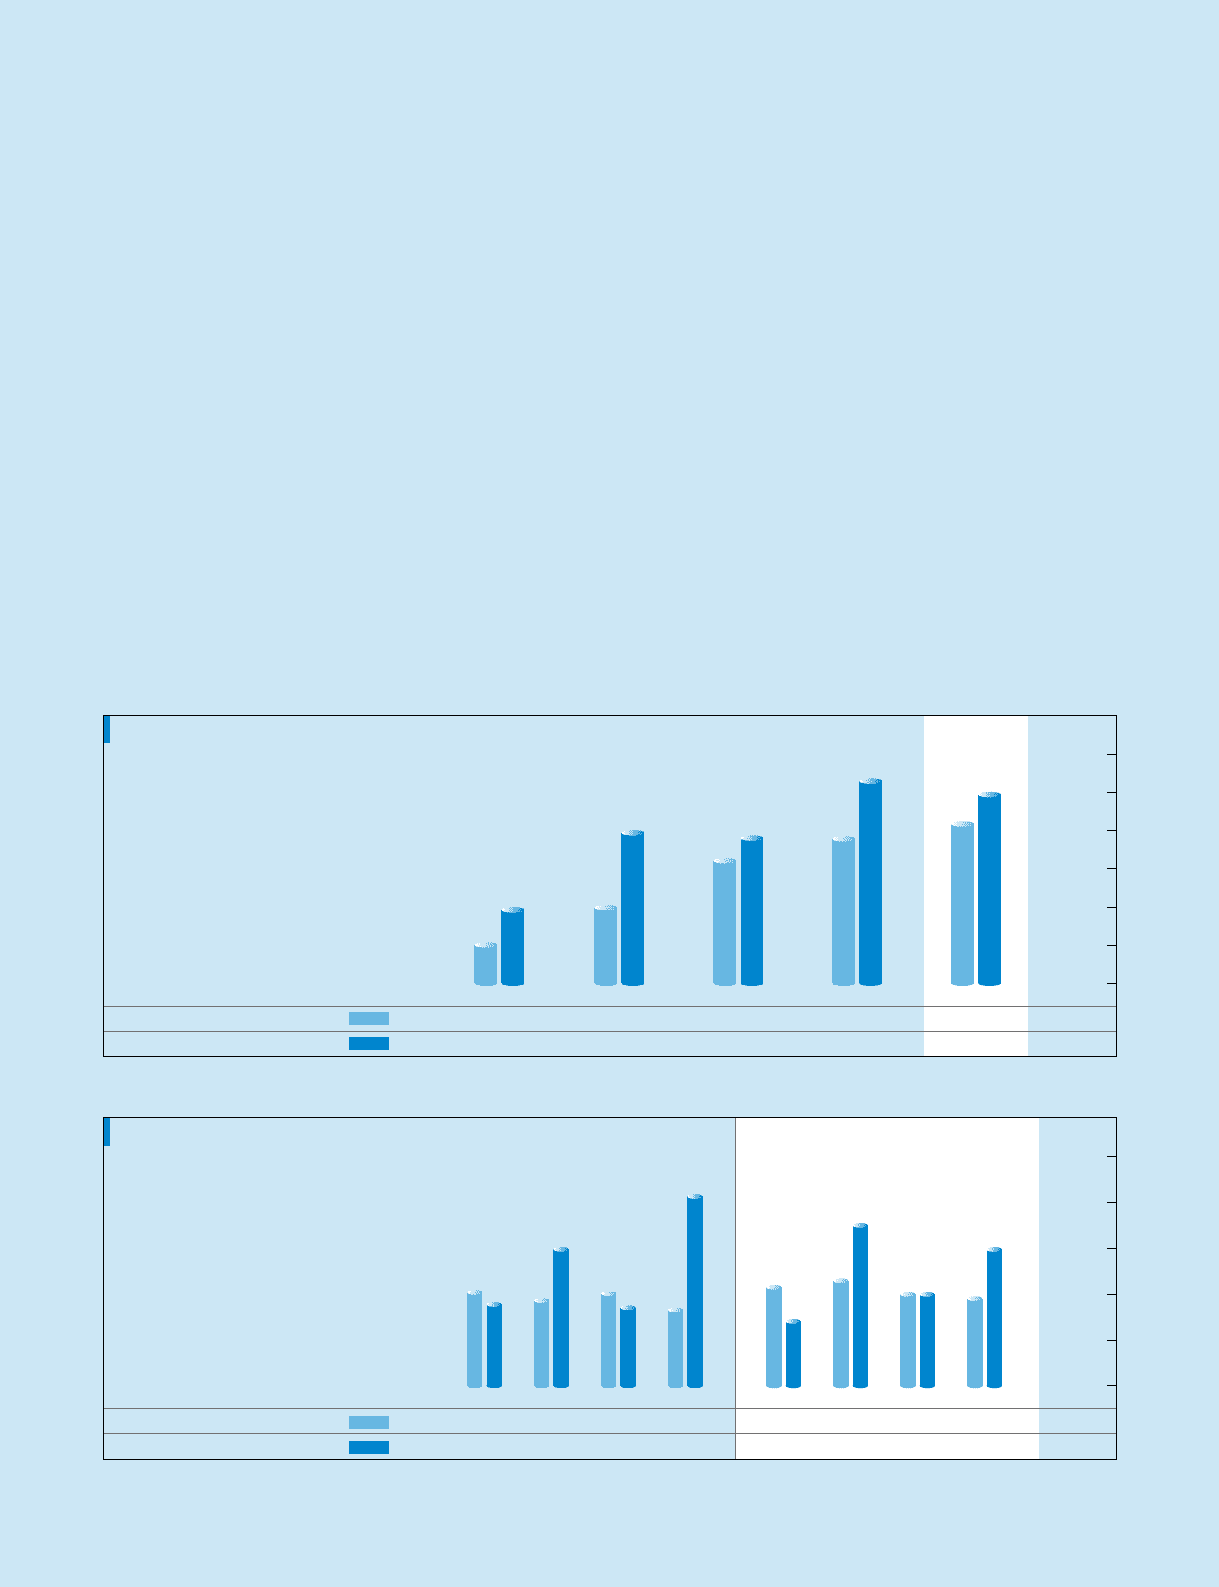
Net Cash Provided by Operating Activities
(Millions of yen)
120
,
000
100
,
000
80
,
000
60
,
000
40
,
000
20
,
000
0
2003 2004 2005 2006
2007
Quarterly Net Cash Provided by Operating Activities
(Millions of yen)
50
,
000
40
,
000
30
,
000
20
,
000
10
,
000
0
(Millions of yen)
(Millions of yen)
1
Q
2
Q
3
Q
2006
4
Q1Q 2Q 3Q
2007
4Q
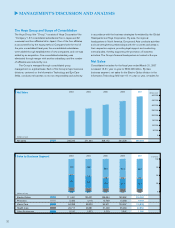
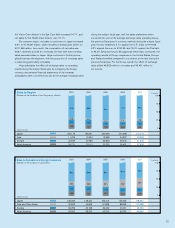
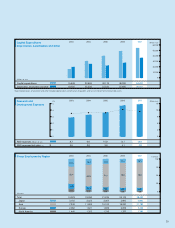
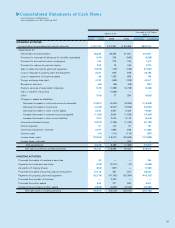
Cash Flows
Cash provided by operating activities amounted to ¥98,793 million,
a decrease of ¥7,062 million from the previous fiscal year. The main
factors with a positive impact on cash were income before income
taxes and minority interests of ¥107,132 million (up ¥9,765 million
year on year) and depreciation and amortization of ¥36,339 million
(up ¥10,087 million). The main factors with a negative impact on
cash were an increase in notes and accounts receivable of ¥13,801
million (up ¥9,759 million year on year), gain on sales of property,
plant and equipment of ¥9,629 million (up ¥9,520 million), an
increase in inventories of ¥4,799 million (up ¥2,252 million), and
income taxes paid of ¥23,362 million (up ¥5,115 million).
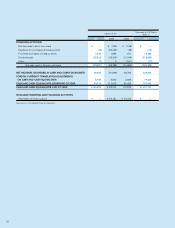
Net cash used in investing activities amounted to ¥46,652
million, a decrease of ¥5,361 million from the previous fiscal year.
Despite expenditures of ¥52,379 million for purchases of property,
plant and equipment (up ¥4,637 million year on year), the decline
stemmed mainly from proceeds from sales of property, plant and
equipment of ¥10,218 million (up ¥9,951 million).
Net cash used in financing activities amounted to ¥23,891
million, a decrease of ¥61,897 million from the previous fiscal year.
Although dividends paid totaled ¥25,810 million (up ¥2,407 million
year on year), the decline stemmed mainly from payments for
purchases of treasury stock (¥64,032 million in the previous fiscal
year), which fell to just ¥13 million for the subject fiscal year.
As a result of the above, the balance of cash and cash
equivalents at the end of the subject fiscal year totaled ¥120,622
million, an increase of ¥37,048 million.
Net income
Net cash provided by operating activities
Net income
Net cash provided by operating activities
274
,
289
224
,
219
81
.
7
289
,
887
218
,
979
75
.
5
351
,
482
277
,
889
79
.
1
361
,
538
279
,
481
77
.
3
447,644
365,102
81.6
20
,
038
38
,
390
39
,
549
78
,
744
64
,
135
76
,
000
75
,
620
105
,
855
83,391
98,793
20
,
389
17
,
759
18
,
596
29
,
802
20
,
120
17
,
025
16
,
515
41
,
269
21,500
14,066
22,899
35,017
19,964
19,950
19,028
29,760