Pentax 2007 Annual Report Download - page 69
Download and view the complete annual report
Please find page 69 of the 2007 Pentax annual report below. You can navigate through the pages in the report by either clicking on the pages listed below, or by using the keyword search tool below to find specific information within the annual report.-
 1
1 -
2
-
3
-
4
-
5
-
6
-
7
-
8
-
9
-
10
-
11
-
12
-
13
-
14
-
15
-
16
-
17
-
18
-
19
-
20
-
21
-
22
-
23
-
24
-
25
-
26
-
27
-
28
-
29
-
30
-
31
-
32
-
33
-
34
-
35
-
36
-
37
-
38
-
39
-
40
-
41
-
42
-
43
-
44
-
45
-
46
-
47
-
48
-
49
-
50
-
51
-
52
-
53
-
54
-
55
-
56
-
57
-
58
-
 59
59 -
 60
60 -
 61
61 -
 62
62 -
 63
63 -
 64
64 -
 65
65 -
 66
66 -
 67
67 -
 68
68 -
 69
69 -
 70
70 -
 71
71 -
 72
72 -
 73
73 -
 74
74 -
 75
75 -
 76
76 -
 77
77 -
 78
78
 |
 |

67
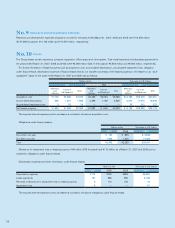
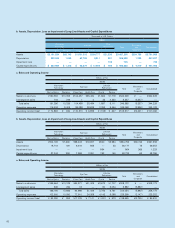
b. Assets, Depreciation, Loss on Impairment of Long-Lived Assets and Capital Expenditures
Millions of Yen
2005
Information
Technology Eye Care Lifestyle
Refinement Total
Eliminations
and
Corporate
Consolidated
Electro-Optics Photonics Vision Care Health Care Crystal Service
Assets ¥162,638 ¥7,648 ¥90,765 ¥18,330 ¥1,900 ¥3,216 ¥284,497 ¥66,985 ¥351,482
Depreciation 14,730 126 5,900 669 — 82 21,507 154 21,661
Impairment loss — 767 — — 92 — 859 — 859
Capital expenditures 31,962 191 6,787 738 92 219 39,989 186 40,175
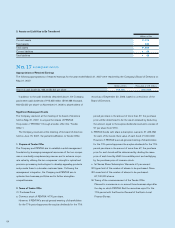
Notes: 1. The Company and subsidiaries primarily engage in the manufacture and sale of products in five major segments grouped on the basis of similarities in the types,
nature and market of the products. The five segments, namely, Electro-Optics, Photonics, Vision Care, Health Care and Other Businesses, consist primarily of the
following products:
Electro-Optics: Photomasks and mask blanks for semiconductors, masks for liquid-crystal display (LCD), parts for glass panels of LCDs, glass disks for hard
disk drives (HDDs), optical lenses, optical glasses, electronic glasses, optical communication products, etc.
Photonics: Laser equipment, light sources for use in the electronics industry, special optical glass, etc.
Vision Care: Eyeglasses, eyeglass frames, etc.
Health Care: Contact lenses and related accessories, intraocular lenses, etc.
Other Businesses: Crystal glass products, construction of information systems, outsourcing, etc.
2. The Crystal and Services businesses used to be presented separately as individual divisions. However, shrinking sales and operating income brought about by
restructuring has reduced the importance of separate presentation, and from the fiscal year ended March 31, 2007, these businesses are presented together as
“Other Businesses.”
3. Corporate operating expenses consist primarily of the administration expenses of the Company and foreign holding companies, which are not allocated to
industry segments. Corporate operating expenses for the years ended March 31, 2007, 2006 and 2005 were ¥3,370 million ($28,547 thousand), ¥2,630 million
and ¥2,873 million, respectively.
4. Corporate assets consist primarily of cash, time deposits, investment securities and administrative assets of the Company and the foreign holding companies.
Corporate assets as of March 31, 2007, 2006 and 2005 were ¥61,381 million ($519,958 thousand), ¥35,135 million and ¥75,076 million, respectively.
5. Consolidated operating expenses are equal to the total of cost of sales and selling, general and administrative expenses shown in the accompanying
consolidated statements of income.
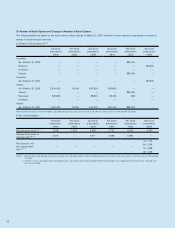
(2) Geographical Segments
The geographical segments of the Company and subsidiaries for the years ended March 31, 2007, 2006 and 2005 are summarized as
follows:
Millions of Yen
2007
Japan North
America Europe Asia Total Eliminations
and Corporate Consolidated
Sales to customers ¥270,373 ¥37,456 ¥ 51,336 ¥ 30,928 ¥390,093 ¥ — ¥390,093
Interarea transfers 26,847 305 813 159,124 187,089 (187,089) —
Total sales 297,220 37,761 52,149 190,052 577,182 (187,089) 390,093
Operating expenses 257,021 36,916 44,663 135,227 473,827 (190,947) 282,880
Operating income 40,199 845 7,486 54,825 103,355 3,858 107,213
Assets ¥193,390 ¥13,507 ¥107,564 ¥207,158 ¥521,619 ¥ (73,975) ¥447,644
Thousands of U.S. Dollars
2007
Japan North
America Europe Asia Total Eliminations
and Corporate Consolidated
Sales to customers $2,290,326 $317,289 $434,867 $ 261,991 $3,304,473 $ — $3,304,473
Interarea transfers 227,421 2,584 6,887 1,347,937 1,584,829 (1,584,829) —
Total sales 2,517,747 319,873 441,754 1,609,928 4,889,302 (1,584,829) 3,304,473
Operating expenses 2,177,222 312,715 378,340 1,145,506 4,013,783 (1,617,510) 2,396,273
Operating income 340,525 7,158 63,414 464,422 875,519 32,681 908,200
Assets $1,638,204 $114,418 $911,173 $1,754,833 $4,418,628 $ (626,642) $3,791,986