Pentax 2007 Annual Report Download - page 35
Download and view the complete annual report
Please find page 35 of the 2007 Pentax annual report below. You can navigate through the pages in the report by either clicking on the pages listed below, or by using the keyword search tool below to find specific information within the annual report.-
 1
1 -
2
-
3
-
4
-
5
-
6
-
7
-
8
-
9
-
10
-
11
-
12
-
13
-
14
-
15
-
16
-
17
-
18
-
19
-
20
-
21
-
22
-
23
-
24
-
 25
25 -
 26
26 -
 27
27 -
 28
28 -
 29
29 -
 30
30 -
 31
31 -
 32
32 -
 33
33 -
 34
34 -
 35
35 -
 36
36 -
 37
37 -
 38
38 -
 39
39 -
 40
40 -
 41
41 -
 42
42 -
 43
43 -
 44
44 -
 45
45 -
46
-
47
-
48
-
49
-
50
-
51
-
52
-
53
-
54
-
55
-
56
-
57
-
58
-
59
-
60
-
61
-
62
-
63
-
64
-
65
-
66
-
67
-
68
-
69
-
70
-
71
-
72
-
73
-
74
-
75
-
76
-
77
-
78
 |
 |

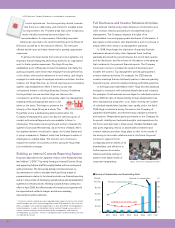
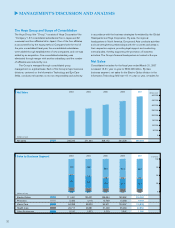
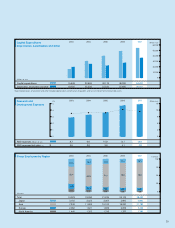
the Vision Care division in the Eye Care field increased 14.7%, and
net sales for the Health Care division rose 15.1%.
By customer region, net sales to customers in Japan increased
2.9% to ¥178,547 million, while net sales overseas grew 23.9% to
¥211,546 million. As a result, the composition of net sales was
45.8% domestic and 54.2% overseas, the first time that overseas
sales exceeded sales in Japan. Hoya continues to further pursue
global business development, with the proportion of overseas sales
in Asia rising particularly noticeably.
Hoya calculates the effect of exchange rates on operating
results during the subject fiscal year by comparing the foreign
currency denominated financial statements of its overseas
subsidiaries when converted into yen at the average exchange rates
during the subject fiscal year, with the same statements when
converted into yen at the average exchange rates prevailing during
the previous fiscal year. In currency markets during the subject fiscal
year, the yen weakened 2.7% against the U.S. dollar to ¥116.96,
9.3% against the euro to ¥150.95, and 15.3% against the Thai baht
to ¥3.24. Because the yen fell against all these main currencies, the
operating results of Group companies in the United States, Europe
and Thailand swelled compared to conversion at the rate during the
previous fiscal year. For the Group overall, the effect of exchange
rates added ¥6,823 million to net sales and ¥5,421 million to
net income.
33
100
75
50
25
0
2003 2004 2005 2006
2007
2003 2004 2005 2006
2007
246
,
293 271
,
444 308
,
172 344
,
228
390,093
45
.
3
2
.
2
38
.
3
49
.
8
1
.
5
36
.
2
53
.
8
3
.
5
30
.
8
(% of total)
100
75
50
25
0
2003 2004 2005 2006
2007
166
,
178
11
,
705
32
,
639
35
,
771
188
,
441
12
,
404
37
,
486
33
,
113
230
,
946
12
,
648
33
,
803
30
,
775
244
,
998
24
,
527
39
,
232
35
,
471
270,373
30,928
51,336
37,456
(% of total)
100
75
50
25
0
2003 2004 2005 2006
2007
138
,
006
32
,
806
38
,
789
36
,
692
148
,
325
44
,
668
40
,
168
38
,
283
166
,
414
61
,
808
36
,
430
43
,
520
173
,
506
86
,
848
41
,
201
42
,
673
178,547
113,068
53,524
44,954
55
.
4
30
.
4
(Millions of yen)
(Millions of yen)
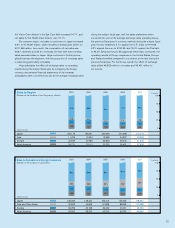
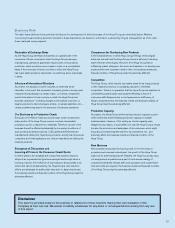
Sales by Region
(Based on the location of the Company’s offices)
Sales to Domestic and Foreign Customers
(Based on the location of customers)
56
.
2
30
.
7
111
,
461
5
,
485
94
,
388
26
,
717
8
,
242
135
,
071
4
,
116
98
,
203
28
,
381
5
,
673
165
,
664
10
,
749
94
,
971
31
,
409
5
,
379
190
,
552
10
,
093
104
,
457
35
,
484
3
,
642
219,252
9,093
119,808
40,850
1,090
2
.
92
.
3
3
.
3 2
.
1 1
.
7 1
.
0 0
.
3
10
.
910
.
410
.
210
.
5
10
.
3
67
.
5
4
.
8
13
.
2
14
.
5
69
.
4
4
.
6
13
.
8
12
.
2
74
.
9
4
.
1
11
.
0
10
.
0
71
.
2
7
.
1
11
.
4
10
.
3
69
.
3
7
.
9
13
.
2
9
.
6
56
.
0
13
.
3
15
.
8
14
.
9
54
.
6
16
.
5
14
.
8
14
.
1
54
.
0
20
.
1
11
.
8
14
.
1
50
.
4
25
.
2
12
.
0
12
.
4
45
.
8
29
.
0
13
.
7
11
.
5
400
,
000
350
,
000
300
,
000
250
,
000
200
,
000
150
,
000
100
,
000
50
,
000
0
Japan
Asia
Europe
North America
Japan
Asia and Other Areas
Europe
North America