Pentax 2007 Annual Report Download - page 41
Download and view the complete annual report
Please find page 41 of the 2007 Pentax annual report below. You can navigate through the pages in the report by either clicking on the pages listed below, or by using the keyword search tool below to find specific information within the annual report.-
 1
1 -
2
-
3
-
4
-
5
-
6
-
7
-
8
-
9
-
10
-
11
-
12
-
13
-
14
-
15
-
16
-
17
-
18
-
19
-
20
-
21
-
22
-
23
-
24
-
25
-
26
-
27
-
28
-
29
-
30
-
 31
31 -
 32
32 -
 33
33 -
 34
34 -
 35
35 -
 36
36 -
 37
37 -
 38
38 -
 39
39 -
 40
40 -
 41
41 -
 42
42 -
 43
43 -
 44
44 -
 45
45 -
 46
46 -
 47
47 -
 48
48 -
 49
49 -
 50
50 -
 51
51 -
52
-
53
-
54
-
55
-
56
-
57
-
58
-
59
-
60
-
61
-
62
-
63
-
64
-
65
-
66
-
67
-
68
-
69
-
70
-
71
-
72
-
73
-
74
-
75
-
76
-
77
-
78
 |
 |
39
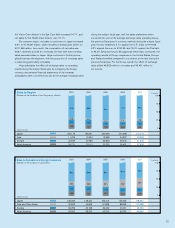
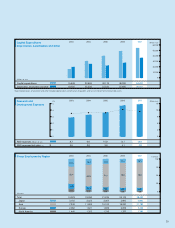
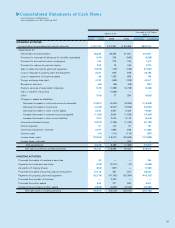
Group Employees by Region (% of total)
100
75
50
25
0
2003 2004 2005 2006
2007
14
,
023
3
,
150
7
,
346
2
,
082
1
,
445
18
,
092
3
,
023
11
,
925
1
,
821
1
,
323
21
,
234
3
,
007
15
,
102
1
,
809
1
,
316
25
,
176
2
,
800
19
,
030
2
,
009
1
,
337
28,450
2,861
21,780
2,429
1,380
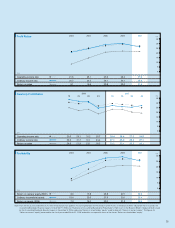
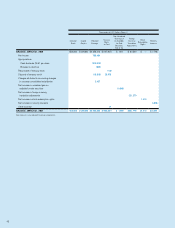
Research and
Development Expenses
(%)
5
4
3
2
1
0
2003 2004 2005 2006
2007
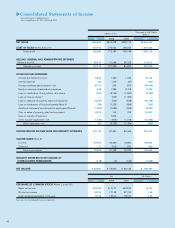
(Millions of yen)
60
,
000
50
,
000
40
,
000
30
,
000
20
,
000
10
,
000
0
2003 2004 2005 2006
2007
15
,
948
19
,
792
30
,
659
25
,
328
40
,
175
22
,
520
48
,
786
27
,
485
54,432
36,427
(Millions of yen)
(Persons)
Note: Depreciation, amortization and other includes depreciation, amortization of goodwill, and loss on impairment of long-lived assets.
Capital Expenditures
Depreciation, Amortization and Other
40
20
0
50
,
000
40
,
000
30
,
000
20
,
000
10
,
000
0
2005 2006
2007
31
,
409
7
,
141
22
.
7
18
,
330
669
738
35
,
484
6
,
859
19
.
3
19
,
927
855
2
,
391
40,850
9,215
22.6
24,410
1,170
2,119
22
.
5
52
.
4
14
.
8
16
.
7
65
.
9
10
.
1
14
.
2
71
.
1
8
.
5
11
.
1
75
.
6
8
.
0
10
.
37
.
36
.
25
.
3
10
.
1
76
.
6
8
.
5
4
.
9
Capital expenditures
Depreciation, amortization and other
R&D expenses (Billions of yen)
R&D expenses/net sales (%)
8
.
7
3
.
5
9
.
8
3
.
6
10
.
9
3
.
6
14
.
1
4
.
1
14.9
3.8
Total
Japan
Asia
Europe
North America
(Billions of yen)
15
12
9
6
3
0