Pentax 2007 Annual Report Download - page 36
Download and view the complete annual report
Please find page 36 of the 2007 Pentax annual report below. You can navigate through the pages in the report by either clicking on the pages listed below, or by using the keyword search tool below to find specific information within the annual report.-
 1
1 -
2
-
3
-
4
-
5
-
6
-
7
-
8
-
9
-
10
-
11
-
12
-
13
-
14
-
15
-
16
-
17
-
18
-
19
-
20
-
21
-
22
-
23
-
24
-
25
-
 26
26 -
 27
27 -
 28
28 -
 29
29 -
 30
30 -
 31
31 -
 32
32 -
 33
33 -
 34
34 -
 35
35 -
 36
36 -
 37
37 -
 38
38 -
 39
39 -
 40
40 -
 41
41 -
 42
42 -
 43
43 -
 44
44 -
 45
45 -
 46
46 -
47
-
48
-
49
-
50
-
51
-
52
-
53
-
54
-
55
-
56
-
57
-
58
-
59
-
60
-
61
-
62
-
63
-
64
-
65
-
66
-
67
-
68
-
69
-
70
-
71
-
72
-
73
-
74
-
75
-
76
-
77
-
78
 |
 |

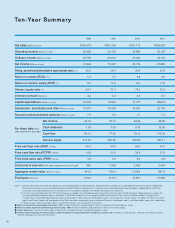
Net Income
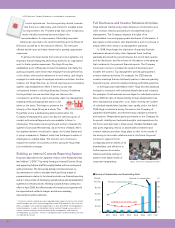
As net sales expanded, the cost of sales also rose, increasing 14.8% year
on year to ¥197,410 million. Because cost of sales grew at a rate greater
than the 13.3% increase in net sales, the gross profit margin slipped to
49.4%, down 0.6 percentage point from 50.0% in the previous fiscal year.
Selling, general and administrative (SG&A) expenses rose 20.2% from the
previous fiscal year to ¥85,470 million, with the ratio of SG&A expenses to
net sales up 1.2 percentage points to 21.9% from 20.7% a year earlier. As
a result, although operating income increased 6.1% to ¥107,213 million,
the operating income ratio declined 1.9 percentage points to 27.5%. All of
the expenditures were the result of proactive spending to ensure future
growth, including capital expenditures and marketing activities, as well as
research and development, and personnel increases. By quarter, the
operating income ratio was 29.4% in the first quarter, 28.4% in the second
quarter, 27.5% in the third quarter and 24.8% in the fourth quarter.
Ordinary income for the subject fiscal year declined 0.7% year on year
to ¥102,909 million. This was due mainly to foreign exchange losses during
the subject fiscal year of ¥6,711 million, compared to a gain of ¥243 million
during the previous fiscal year, arising from the effect of exchange rate
conversions related to credit and debit of funds between Group compa-
nies, along with a decline in equity in earnings of affiliates from ¥1,285
million the previous fiscal year to ¥642 million for the subject fiscal year.
Other income and expenses included a ¥9,520 million increase in gain
on sales of property, plant and equipment, against a ¥2,703 million
increase in loss on disposal of property, plant and equipment from the
previous fiscal year, along with a ¥2,958 million decrease in loss on
clarification of soil pollution and others, and a ¥1,145 million decrease in
loss on impairment. As a result, net income for the subject fiscal year rose
10.3% year on year to ¥83,391 million.
Return on assets (ROA) declined by 0.6 percentage point to 20.6%,
and return on owners’ equity (ROE) fell by 1.2 percentage points to 25.9%.
Dividends for the subject fiscal year consisted of an interim dividend of ¥30
per share and a year-end dividend of ¥35 per share, for an aggregate ¥65
per share for the full year, an increase of ¥5 from the previous fiscal year.
Hoya paid an interim dividend during the previous fiscal year of ¥120 per
share, but if adjusted retroactively to reflect the four-for-one stock split
implemented in November 2005, it is equal to ¥30 per share, which along
with the year-end dividend from the previous fiscal year of ¥30 per share
amounts to a full-year dividend of ¥60 per share.
34
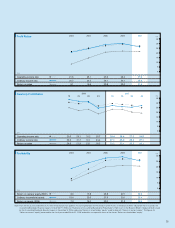
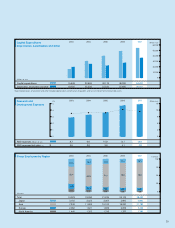
Operating Income,
Ordinary Income and Net Income
(Millions of yen)
120
,
000
100
,
000
80
,
000
60
,
000
40
,
000
20
,
000
0
2003 2004 2005 2006
2007
52
,
983
50
,
874
20
,
038
68
,
167
66
,
554
39
,
549
84
,
920
89
,
525
64
,
135
101
,
096
103
,
638
75
,
620
107,213
102,909
83,391
35
30
25
20
15
10
5
0
2003 2004 2005 2006
2007
21
.
5
20
.
7
8
.
1
25
.
1
24
.
5
14
.
6
27
.
6
29
.
1
20
.
8
29
.
4
30
.
1
22
.
0
27.5
26.4
21.4
30
25
20
15
10
5
0
2003 2004 2005 2006
2007
9
.
0
18
.
4
7
.
3
17
.
8
23
.
6
14
.
0
25
.
8
27
.
9
20
.
0
27
.
1
29
.
1
21
.
2
25.9
25.4
20.6
Quarterly Profits (Millions of yen)
30
,
000
25
,
000
20
,
000
15
,
000
10
,
000
5
,
000
0
1
Q
2
Q
3
Q
2006
4
Q1Q 2Q 3Q
2007
4Q
1
Q
2
Q
3
Q
2006
4
Q1Q 2Q 3Q
2007
4Q
25
,
056
27
,
466
20
,
389
24
,
740
26
,
974
18
,
596
27
,
257
27
,
161
20
,
120
24
,
043
22
,
037
16
,
515
35
30
25
20
15
10
5
0
30
.
6
33
.
6
24
.
9
29
.
1
31
.
7
21
.
9
31
.
2
31
.
1
23
.
1
26
.
7
24
.
4
18
.
3
29.4
27.1
23.2
28.4
25.9
23.1
27.5
25.4
20.2
24.8
27.1
19.1
(Millions of yen)
(Millions of yen)
Operating income
Ordinary income
Net income
Operating income
Ordinary income
Net income
27,241
25,140
21,500
28,125
25,700
22,899
27,216
25,148
19,964
24,631
26,921
19,028