Pentax 2007 Annual Report Download - page 32
Download and view the complete annual report
Please find page 32 of the 2007 Pentax annual report below. You can navigate through the pages in the report by either clicking on the pages listed below, or by using the keyword search tool below to find specific information within the annual report.-
 1
1 -
2
-
3
-
4
-
5
-
6
-
7
-
8
-
9
-
10
-
11
-
12
-
13
-
14
-
15
-
16
-
17
-
18
-
19
-
20
-
21
-
 22
22 -
 23
23 -
 24
24 -
 25
25 -
 26
26 -
 27
27 -
 28
28 -
 29
29 -
 30
30 -
 31
31 -
 32
32 -
 33
33 -
 34
34 -
 35
35 -
 36
36 -
 37
37 -
 38
38 -
 39
39 -
 40
40 -
 41
41 -
 42
42 -
43
-
44
-
45
-
46
-
47
-
48
-
49
-
50
-
51
-
52
-
53
-
54
-
55
-
56
-
57
-
58
-
59
-
60
-
61
-
62
-
63
-
64
-
65
-
66
-
67
-
68
-
69
-
70
-
71
-
72
-
73
-
74
-
75
-
76
-
77
-
78
 |
 |

30
¥201,290
31,726
33,612
17,837
26.4
7.8
11.6
71.7
3.2
13,654
18,234
7.8
37.77
7.50
77.65
340.56
44.5
21.6
4.9
1,680
780.4
9,414
¥193,473
26,395
26,759
12,348
28.2
5.3
8.5
63.7
3.4
19,504
17,570
7.5
26.12
7.00
64.41
317.67
36.4
14.8
3.0
950
441.3
9,320
¥201,110
34,688
35,484
20,716
25.4
8.9
12.4
73.2
3.3
17,770
16,051
7.7
44.06
8.75
79.15
376.55
55.0
30.6
6.4
2,425
1,126.4
10,651
¥236,802
45,128
48,184
21,860
23.8
8.6
11.8
73.0
3.1
39,673
32,138
7.3
46.65
12.50
116.24
420.11
43.7
17.6
4.9
2,040
947.6
12,966
1998 1999 2000 2001
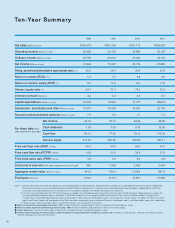
Notes: 1. Effective April1, 2002, the Company adopted “Accounting Standard for Earnings Per Share” (Statement No.2 issued by the Accounting Standards Board of Japan on September
25, 2002) and “Guidance on Accounting Standard for Earnings Per Share” (Guidance No.4 issued by the Accounting Standards Board of Japan on September 25, 2002). Net
income per share and related data prior to that date are also calculated according to the standard for purposes of comparison.
2. From the fiscal year ended March 31, 2007, the Company has applied “Accounting Standard for Presentation of Net Assets in the Balance Sheet” (Statement No.5 issued by the
Accounting Standards Board of Japan on December 9, 2005) and “Guidance on Accounting Standard for Presentation of Net Assets in the Balance Sheet” (Guidance No.8
issued by the Accounting Standards Board of Japan on December 9, 2005) replacing “Shareholders’ equity” used to date with “Owners’ equity.” The figures for “Return on owners’
equity” and “Owners’ equity ratio” presented for fiscal 2006 and earlier correspond to those of the former “Return on shareholders’ equity” and “Shareholders’ equity ratio,” respectively.
3. “Owners’ equity”: “Stock subscription rights” and “Minority interests” are excluded from “Net assets.”
● Return on assets (net income/average total assets x 100): An index of efficiency and profitability in terms of management of the Company’s assets.
● Return on owners’ equity (net income/average owners’ equity x 100): An index of efficiency and profitability in terms of the owners’ equity.
● Owners’ equity ratio: The ratio of owners’ equity to total assets; the higher the ratio, the higher the degree of safety.
● Inventory turnover (average of inventory assets at beginning and end of fiscal period/monthly average cost of goods sold): An index of capital efficiency. The fewer the number of months,
the better the production and sales efficiencies.
●
●
●
●
●
●
●
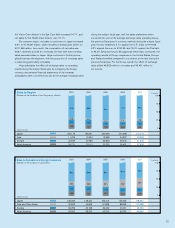
Net sales (Millions of yen)
Operating income (Millions of yen)
Ordinary income (Millions of yen)
Net income (Millions of yen)
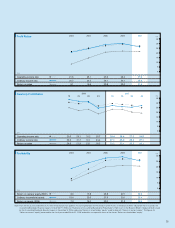
Selling, general and administrative expenses/net sales
(%)
Return on assets (ROA) (%)
Return on owners’ equity (ROE) (%)
Owners’ equity ratio (%)
Inventory turnover (Months)
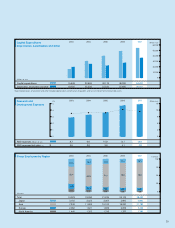
Capital expenditures (Millions of yen)
Depreciation, amortization and other
(Millions of yen)
Research and development expenses
(Billions of yen)
Net income
Cash dividends
Cash flow
Owners’ equity
Price earnings ratio (PER) (Times)
Price cash flow ratio (PCFR) (Times)
Price book value ratio (PBR) (Times)
Stock price at year-end
(Yen) (
after adjustment for stock split
)
Aggregate market value (Billions of yen)
Employees (Persons)
Ten-Year Summary
Per share data (Yen)
(
after adjustment for stock split
)