Pentax 2007 Annual Report Download - page 39
Download and view the complete annual report
Please find page 39 of the 2007 Pentax annual report below. You can navigate through the pages in the report by either clicking on the pages listed below, or by using the keyword search tool below to find specific information within the annual report.-
 1
1 -
2
-
3
-
4
-
5
-
6
-
7
-
8
-
9
-
10
-
11
-
12
-
13
-
14
-
15
-
16
-
17
-
18
-
19
-
20
-
21
-
22
-
23
-
24
-
25
-
26
-
27
-
28
-
 29
29 -
 30
30 -
 31
31 -
 32
32 -
 33
33 -
 34
34 -
 35
35 -
 36
36 -
 37
37 -
 38
38 -
 39
39 -
 40
40 -
 41
41 -
 42
42 -
 43
43 -
 44
44 -
 45
45 -
 46
46 -
 47
47 -
 48
48 -
 49
49 -
50
-
51
-
52
-
53
-
54
-
55
-
56
-
57
-
58
-
59
-
60
-
61
-
62
-
63
-
64
-
65
-
66
-
67
-
68
-
69
-
70
-
71
-
72
-
73
-
74
-
75
-
76
-
77
-
78
 |
 |
37
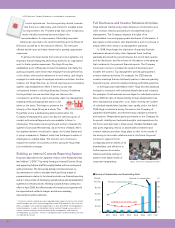
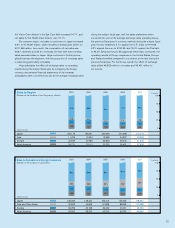
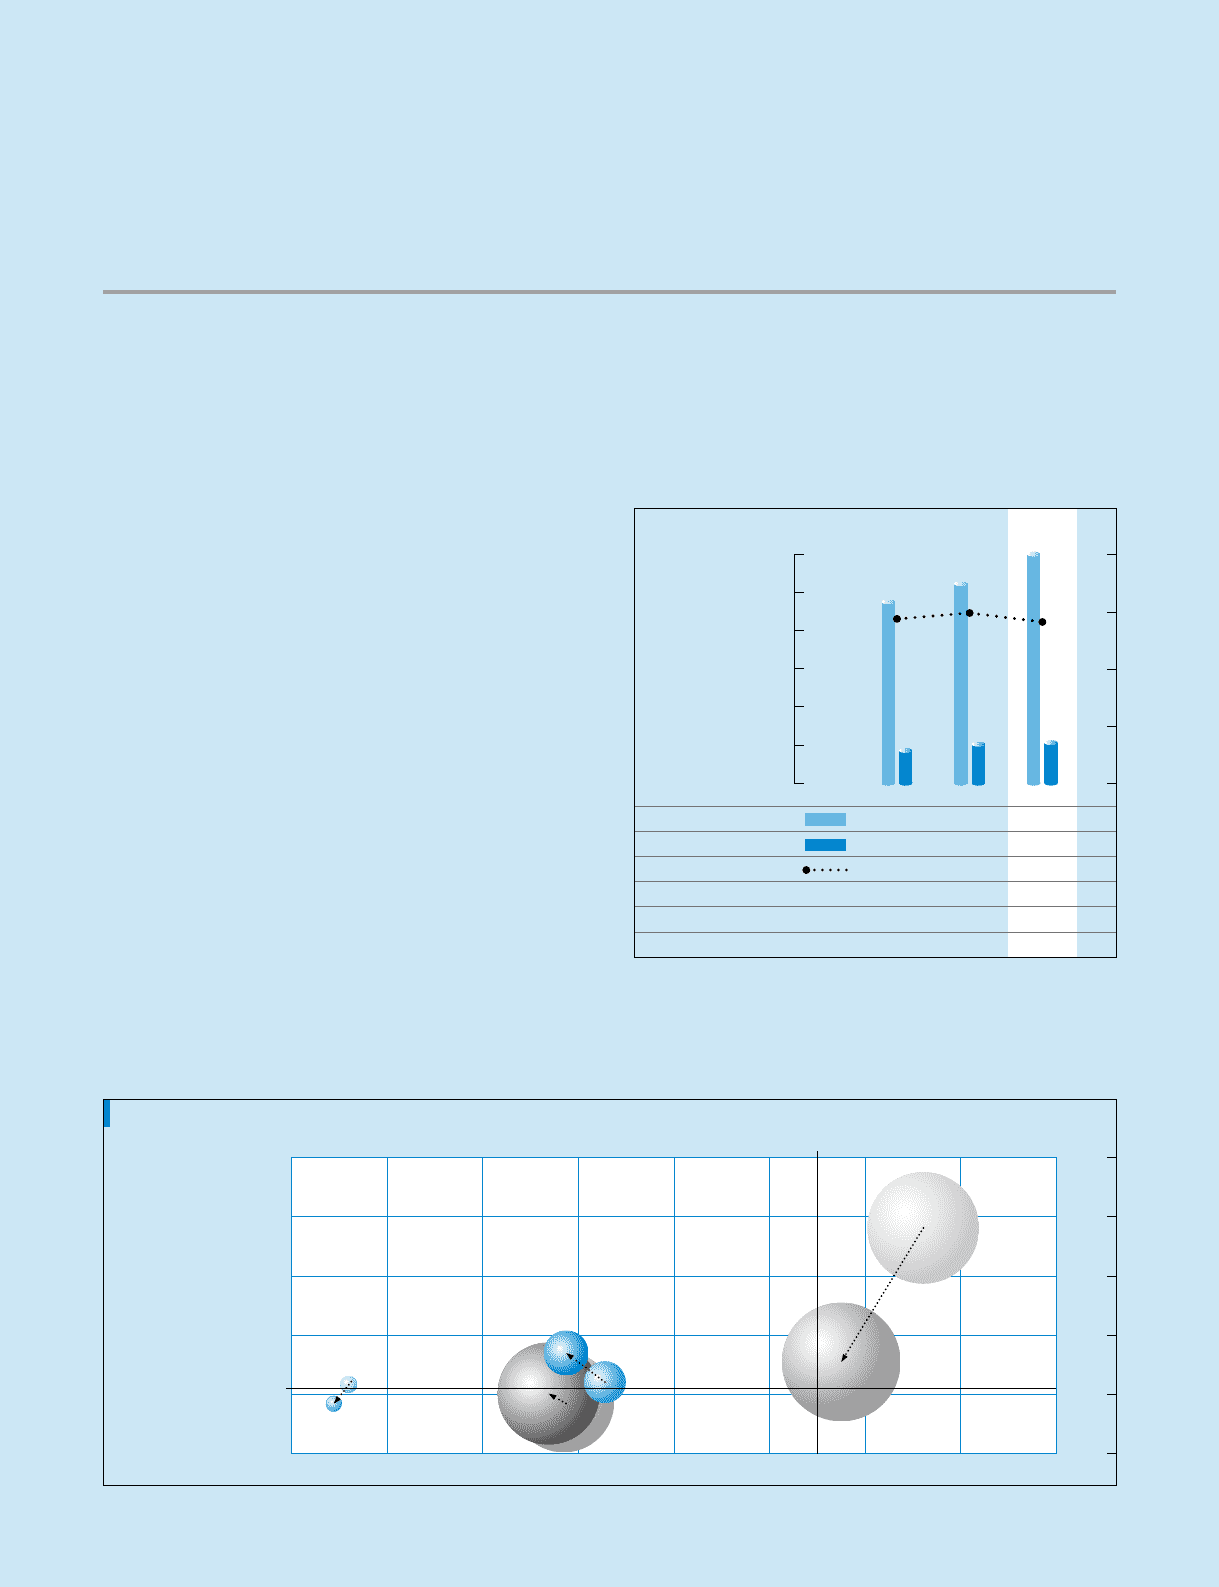
Net sales of the Vision Care division rose 14.7% to ¥119,808
million. In the domestic eyeglass lens market there were signs of a
shrinking of the market due to population decline and greater
prevalence of low-cost products manufactured in Asia, but Hoya
managed to keep sales to a 0.1% increase, roughly on par with
the previous fiscal year, through introduction of new products and
enhanced marketing for high-value-added products. In Europe,
where demand for high-value-added lenses is strong, sales were
up 27.0% year on year, the fruit of strategies tailored to the
preferences of each region. In the Asia-Pacific region, although the
market is strongly oriented toward low-cost products, there has
been a steady increase in customers specifically requesting
Hoya’s high-value-added products. Further, a focus on marketing
activities tailored to the market characteristics of the Asia-Pacific
region, such as the introduction of new brands, led to a 14.5% rise
in sales. In North America as well, the market penetration of the
Hoya brand is steadily rising, and revenue rose 15.5% from the
previous fiscal year.
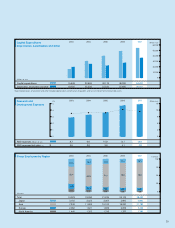
Operating income for the Vision Care division increased 3.9%
from the previous fiscal year to ¥21,167 million, with an operating
income ratio of 17.7%, 1.8 percentage points lower than in the
previous fiscal year. The main factor pushing down the operating
income ratio was proactive investment in marketing and sales
promotions oriented toward the future of overseas markets. By
quarter, the operating income ratio was 18.5% in the first quarter,
18.1% in the second quarter, 16.8% in the third quarter and 17.4%
in the fourth quarter. Although profit margins declined, expansion in
overseas markets allowed Hoya to achieve sales growth that
exceeded the growth rate on a consolidated basis, shifting the
40
20
0
250
,
000
200
,
000
150
,
000
100
,
000
50
,
000
0
2005 2006
165
,
664
63
,
290
38
.
1
162
,
638
14
,
730
31
,
962
190
,
552
74
,
862
39
.
1
204
,
192
18
,
716
37
,
244
219,252
80,085
36.5
258,746
27,449
39,899
(Millions of yen)
120
,
000
100
,
000
80
,
000
60
,
000
40
,
000
20
,
000
0
2005 2006
Net sales (Millions of yen)
Operating income (Millions of yen)
Operating income ratio* (%)
Assets (Millions of yen)
Depreciation (Millions of yen)
Capital expenditures (Millions of yen)
94
,
971
17
,
079
18
.
0
90
,
765
5
,
900
6
,
787
104
,
457
20
,
370
19
.
5
98
,
243
6
,
444
7
,
958
119,808
21,167
17.7
118,229
7,405
11,672
17
15
13
11
9
15
20
25
30
35
40
* The operating income ratio above is calculated using net sales plus intersegment
sales. Please refer to details on page 65, Segment Information.
2007
2007
(%)
40
20
0
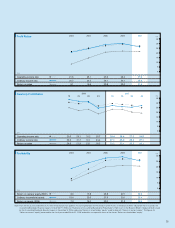
Sales Growth and Profitability by Geographical Segment
Fiscal year ended March 31, 2007 (Compared with the previous fiscal year)
Sales Growth Ratio (%)
0
5
10
15
20
25
30
35
40
Operating Income Ratio (%)
Consolidated Basis
Consolidated Basis
130
100
70
40
10
-
20
Size of circle shows the volume of operating income.
Eye Care (Vision Care Division)
position of the circles in the segment graph upward and to the left.
Capital expenditures in the Vision Care division increased
46.7% to ¥11,672 million. The main uses for this investment were
investments of funds to further develop an IT system and develop
new products, along with efforts to establish a global production
structure aimed at optimal production locations.
Japan
North America
Asia
Europe