Pentax 2007 Annual Report Download - page 38
Download and view the complete annual report
Please find page 38 of the 2007 Pentax annual report below. You can navigate through the pages in the report by either clicking on the pages listed below, or by using the keyword search tool below to find specific information within the annual report.-
 1
1 -
2
-
3
-
4
-
5
-
6
-
7
-
8
-
9
-
10
-
11
-
12
-
13
-
14
-
15
-
16
-
17
-
18
-
19
-
20
-
21
-
22
-
23
-
24
-
25
-
26
-
27
-
 28
28 -
 29
29 -
 30
30 -
 31
31 -
 32
32 -
 33
33 -
 34
34 -
 35
35 -
 36
36 -
 37
37 -
 38
38 -
 39
39 -
 40
40 -
 41
41 -
 42
42 -
 43
43 -
 44
44 -
 45
45 -
 46
46 -
 47
47 -
 48
48 -
49
-
50
-
51
-
52
-
53
-
54
-
55
-
56
-
57
-
58
-
59
-
60
-
61
-
62
-
63
-
64
-
65
-
66
-
67
-
68
-
69
-
70
-
71
-
72
-
73
-
74
-
75
-
76
-
77
-
78
 |
 |

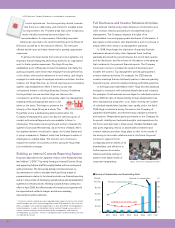
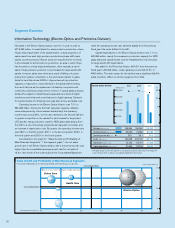
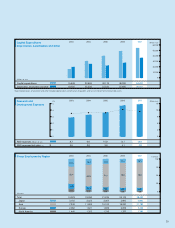
Net sales in the Electro-Optics division rose 15.1% year on year to
¥219,252 million. In mask blanks for semiconductor production, where
Hoya holds a large share of the global market, a rising proportion of
sales came from such high-precision products as phase shift mask
blanks, as semiconductor feature sizes are required further to shrink.
In photomasks for semiconductor production, an area in which Hoya
has focused on cutting-edge development, there was also a rise in
sales of high-precision products. In photomasks for large-sized LCD
panels, however, sales were down as a result of falling unit prices
arising from greater competition in the photomask market. In glass
disks for hard disk drives (HDDs), Hoya enhanced its production
capacity in response to robust demand in the global market arising
from such factors as the replacement of desktop computers with
notebooks, achieving a sharp rise in revenue. In optical glass products,
demand for aspheric molded lenses expanded as a result of higher
resolutions and enhanced zoom features in digital cameras. Demand
for camera lenses for mobile phones was also strong, and sales rose.
Operating income in the Electro-Optics division rose 7.0% to
¥80,085 million. During the first half, high plant capacity utilization
rates underpinned by robust market demand kept the operating
income ratio around 38%, but the ratio declined in the second half due
to greater competition in the market for photomasks for large-sized
LCD panels, rising production costs for HDD glass disks arising from
the shift to a new technology (perpendicular magnetic recording), and
an increase in depreciation cost. By quarter, the operating income ratio
was 38.6% in the first quarter, 38.1% in the second quarter, 36.6% in
the third quarter and 32.6% in the fourth quarter.
As indicated in the graph for “Sales Growth and Profitability of
Main Business Segments” (“the segment graph”), the net sales
growth rate in the Electro-Optics division, like in the previous year, was
higher than the consolidated average growth rate for net sales of
13.3% (the center of the circle is above the Consolidated Basis line),
while the operating income ratio declined slightly from the previous
fiscal year (the circle shifted to the left).
Capital expenditures in the Electro-Optics division rose 7.1% to
¥39,899 million, mainly for increases in production capacity for HDD
glass disks and optical lenses, and the establishment of a new plant
for large-sized LCD mask blanks.
Net sales for the Photonics division fell 9.9% from the previous
fiscal year to ¥9,093 million, while operating income fell 47.5% to
¥490 million. The main reason for the decline was a significant falloff in
sales of pattern defect correction equipment for LCDs.
36
Segment Overview
(%)
40
20
0
(Millions of yen)
250
,
000
200
,
000
150
,
000
100
,
000
50
,
000
0
2005 2006
Net sales (Millions of yen)
Operating income (Millions of yen)
Operating income ratio* (%)
Assets (Millions of yen)
Depreciation (Millions of yen)
Capital expenditures (Millions of yen)
165
,
664
63
,
290
38
.
1
162
,
638
14
,
730
31
,
962
190
,
552
74
,
862
39
.
1
204
,
192
18
,
716
37
,
244
219,252
80,085
36.5
258,746
27,449
39,899
120
,
000
100
,
000
80
,
000
60
,
000
40
,
000
20
,
000
0
2005 2006
94
,
971
17
,
079
18
.
0
90
,
765
5
,
900
6
,
787
104
,
457
20
,
370
19
.
5
98
,
243
6
,
444
7
,
958
119,808
21,167
17.7
118,229
7,405
11,672
Sales Growth and Profitability of Main Business Segments
Fiscal year ended March 31, 2007 (Compared with the previous fiscal year)
Sales Growth Ratio (%)
17
15
13
11
9
15
20
25
30
35
40
* The operating income ratio above is calculated using net sales plus intersegment
sales. Please refer to details on page 65, Segment Information.
Electro-Optics Division
Operating Income Ratio (%)
Consolidated Basis
Consolidated Basis
2007
2007
40
20
0
Health Care
Vision Care
Electro-Optics
Size of circle shows the volume of operating income.
0
5
10
15
20
25
30
35
40
130
100
70
40
10
-
20
Information Technology (Electro-Optics and Photonics Division)