Pentax 2005 Annual Report Download - page 70
Download and view the complete annual report
Please find page 70 of the 2005 Pentax annual report below. You can navigate through the pages in the report by either clicking on the pages listed below, or by using the keyword search tool below to find specific information within the annual report.-
 1
1 -
2
-
3
-
4
-
5
-
6
-
7
-
8
-
9
-
10
-
11
-
12
-
13
-
14
-
15
-
16
-
17
-
18
-
19
-
20
-
21
-
22
-
23
-
24
-
25
-
26
-
27
-
28
-
29
-
30
-
31
-
32
-
33
-
34
-
35
-
36
-
37
-
38
-
39
-
40
-
41
-
42
-
43
-
44
-
45
-
46
-
47
-
48
-
49
-
50
-
51
-
52
-
53
-
54
-
55
-
56
-
57
-
58
-
59
-
 60
60 -
 61
61 -
 62
62 -
 63
63 -
 64
64 -
 65
65 -
 66
66 -
 67
67 -
 68
68 -
 69
69 -
 70
70 -
 71
71 -
 72
72 -
 73
73 -
 74
74 -
 75
75 -
 76
76 -
 77
77 -
 78
78 -
 79
79
 |
 |

67
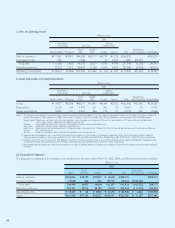
Thousands of U.S. Dollars
2005
North Eliminations
Japan America Europe Asia Total and Corporate Consolidated
Sales to customers $2,158,374 $287,617 $315,916 $118,205 $2,880,112 $2,880,112
Interarea transfers 178,019 1,869 2,383 838,776 1,021,047 $(1,021,047)
Total sales 2,336,393 289,486 318,299 956,981 3,901,159 (1,021,047) 2,880,112
Operating expenses 1,910,402 288,897 263,505 663,589 3,126,393 (1,039,926) 2,086,467
Operating income $ 425,991 $ 589 $ 54,794 $293,392 $ 774,766 $ 18,879 $ 793,645
Assets $1,550,822 $160,084 $307,729 $973,748 $2,992,383 $ 292,496 $3,284,879
Millions of Yen
2004
North Eliminations
Japan America Europe Asia Total and Corporate Consolidated
Sales to customers ¥188,441 ¥33,113 ¥37,486 ¥12,404 ¥271,444 ¥271,444
Interarea transfers 16,790 91 849 60,196 77,926 ¥(77,926)
Total sales 205,231 33,204 38,335 72,600 349,370 (77,926) 271,444
Operating expenses 167,669 31,390 29,294 54,693 283,046 (79,769) 203,277
Operating income ¥ 37,562 ¥ 1,814 ¥ 9,041 ¥17,907 ¥ 66,324 ¥ 1,843 ¥ 68,167
Assets ¥161,336 ¥19,059 ¥26,691 ¥66,338 ¥273,424 ¥ 16,463 ¥289,887
Millions of Yen
2003
North Eliminations
Japan America Europe Asia Total and Corporate Consolidated
Sales to customers ¥166,178 ¥35,771 ¥32,639 ¥11,705 ¥246,293 ¥246,293
Interarea transfers 17,343 73 1,891 44,514 63,821 ¥(63,821)
Total sales 183,521 35,844 34,530 56,219 310,114 (63,821) 246,293
Operating expenses 148,960 34,898 28,411 45,282 257,551 (64,241) 193,310
Operating income ¥ 34,561 ¥ 946 ¥ 6,119 ¥10,937 ¥ 52,563 ¥ 420 ¥ 52,983
Assets ¥139,012 ¥19,505 ¥34,970 ¥59,156 ¥252,643 ¥ 21,646 ¥274,289
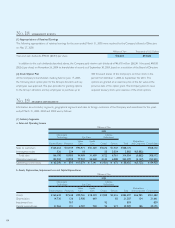
Notes: 1. The Company and subsidiaries are summarized in four segments by geographic area based on the countries where the Group is located. The segments consisted of the
following countries:
North America: United States of America, Canada, etc.
Europe: Netherlands, Germany, United Kingdom, etc.
Asia: Singapore, Thailand, China, Republic of Korea, Taiwan, etc.
2. Corporate operating expenses consist primarily of the administration expenses of the Company and one regional headquarters, which are not allocated to segments
by geographic area. Corporate operating expenses for the years ended March 31, 2005, 2004 and 2003 were ¥2,562 million ($23,944 thousand), ¥2,074 million and
¥1,813 million, respectively.
3. Corporate assets consist primarily of cash, time deposits, investments securities and administrative assets of the Company and one regional headquarters. Corporate assets
as of March 31, 2005, 2004 and 2003 were ¥72,841 million ($680,757 thousand), ¥47,511 million and ¥40,280 million, respectively.
4. Consolidated operating expenses are equal to the total of cost of sales and selling, general and administrative expenses shown in the accompanying consolidated statements
of income.