Pentax 2005 Annual Report Download - page 38
Download and view the complete annual report
Please find page 38 of the 2005 Pentax annual report below. You can navigate through the pages in the report by either clicking on the pages listed below, or by using the keyword search tool below to find specific information within the annual report.-
 1
1 -
2
-
3
-
4
-
5
-
6
-
7
-
8
-
9
-
10
-
11
-
12
-
13
-
14
-
15
-
16
-
17
-
18
-
19
-
20
-
21
-
22
-
23
-
24
-
25
-
26
-
27
-
 28
28 -
 29
29 -
 30
30 -
 31
31 -
 32
32 -
 33
33 -
 34
34 -
 35
35 -
 36
36 -
 37
37 -
 38
38 -
 39
39 -
 40
40 -
 41
41 -
 42
42 -
 43
43 -
 44
44 -
 45
45 -
 46
46 -
 47
47 -
 48
48 -
49
-
50
-
51
-
52
-
53
-
54
-
55
-
56
-
57
-
58
-
59
-
60
-
61
-
62
-
63
-
64
-
65
-
66
-
67
-
68
-
69
-
70
-
71
-
72
-
73
-
74
-
75
-
76
-
77
-
78
-
79
 |
 |

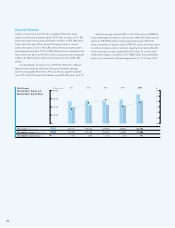
Net Income
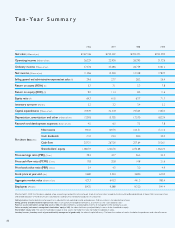
As net sales expanded, the cost of sales also rose, increasing 10.8% year
on year to ¥158,024 million. Because cost of sales grew less than net
sales, which increased 13.5%, the gross profit margin improved to 48.7%,
up 1.3 percentage points from 47.4% in the previous fiscal year. Selling,
general and administrative (SG&A) expenses also rose with the growth
in net sales, increasing 7.6% to ¥65,228 million. SG&A expenses as a
percentage of net sales, however, declined 1.2 percentage points, from
22.3% to 21.1%, because SG&A expenses rose at a lower pace than the
growth rate for net sales.
As a result, operating income increased 24.6% to ¥84,920 million
and the operating margin improved by 2.5 percentage points to 27.6%.
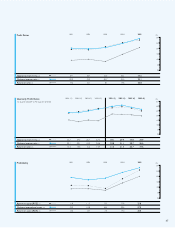
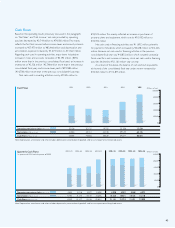
By quarter, the operating margin was 28.1% in the first quarter, 29.4% in
the second quarter, 27.8% in the third quarter and 24.9% in the fourth
quarter.
Net income increased 62.2% to ¥64,135 million. This reflected an
increase of ¥2,008 million in equity in earnings of associated companies
and a significant improvement of ¥3,775 million on foreign exchange
gains (losses), from losses of ¥2,900 million in the previous fiscal year to
¥875 million in gains for the fiscal year under review.
During the fiscal year under review, the Company's management
decided to close the Kyushu Laboratory in 2005. As a result, the
Company incurred a loss of ¥1,264 million on the closure. And the
Company also incurred a loss of ¥1,980 million on clarification of soil
contamination associated with the closure of other plants.
Net income per share improved by ¥227.88, from ¥350.96, to
¥578.84.
Net sales, operating income and net income for the consolidated
fiscal year under review all represented new records as full-year
operating results.
Return on assets (ROA) improved by 6.0 percentage points to
20.0%, and return on equity (ROE) improved by 8.0 percentage points
to 25.8%. For the consolidated fiscal year under review, the Group
increased the annual dividend per share by ¥50 to ¥150.
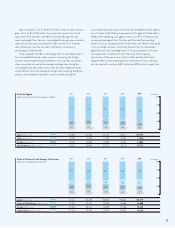
Operating Income,
Ordinary Income
and Net Income
(Millions of yen)
100,000
80,000
60,000
40,000
20,000
0
2001 2002 2003 2004 2005
Operating income (Millions of yen)
Ordinary income (Millions of yen)
Net income (Millions of yen)
45,128
48,184
21,860
43,898
45,774
23,741
52,983
50,874
20,038
68,167
66,554
39,549
84,920
89,525
64,135
Quarterly Profits
1st quarter of 2004 to 4th quarter of 2005
(Millions of yen)
25,000
20,000
15,000
10,000
5,000
0
2004-1Q 2004-2Q 2004-3Q 2004-4Q 2005-1Q 2005-2Q 2005-3Q 2005-4Q
Operating income (Millions of yen)
Ordinary income (Millions of yen)
Net income (Millions of yen)
14,536
14,757
9,795
16,400
15,638
9,129
17,679
17,091
10,419
19,552
19,068
10,206
21,082
22,366
16,223
23,047
24,405
16,671
21,652
22,314
16,123
19,139
20,440
15,118