Pentax 2005 Annual Report Download - page 54
Download and view the complete annual report
Please find page 54 of the 2005 Pentax annual report below. You can navigate through the pages in the report by either clicking on the pages listed below, or by using the keyword search tool below to find specific information within the annual report.-
 1
1 -
2
-
3
-
4
-
5
-
6
-
7
-
8
-
9
-
10
-
11
-
12
-
13
-
14
-
15
-
16
-
17
-
18
-
19
-
20
-
21
-
22
-
23
-
24
-
25
-
26
-
27
-
28
-
29
-
30
-
31
-
32
-
33
-
34
-
35
-
36
-
37
-
38
-
39
-
40
-
41
-
42
-
43
-
 44
44 -
 45
45 -
 46
46 -
 47
47 -
 48
48 -
 49
49 -
 50
50 -
 51
51 -
 52
52 -
 53
53 -
 54
54 -
 55
55 -
 56
56 -
 57
57 -
 58
58 -
 59
59 -
 60
60 -
 61
61 -
 62
62 -
 63
63 -
 64
64 -
65
-
66
-
67
-
68
-
69
-
70
-
71
-
72
-
73
-
74
-
75
-
76
-
77
-
78
-
79
 |
 |
51
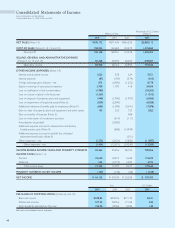
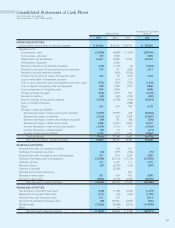
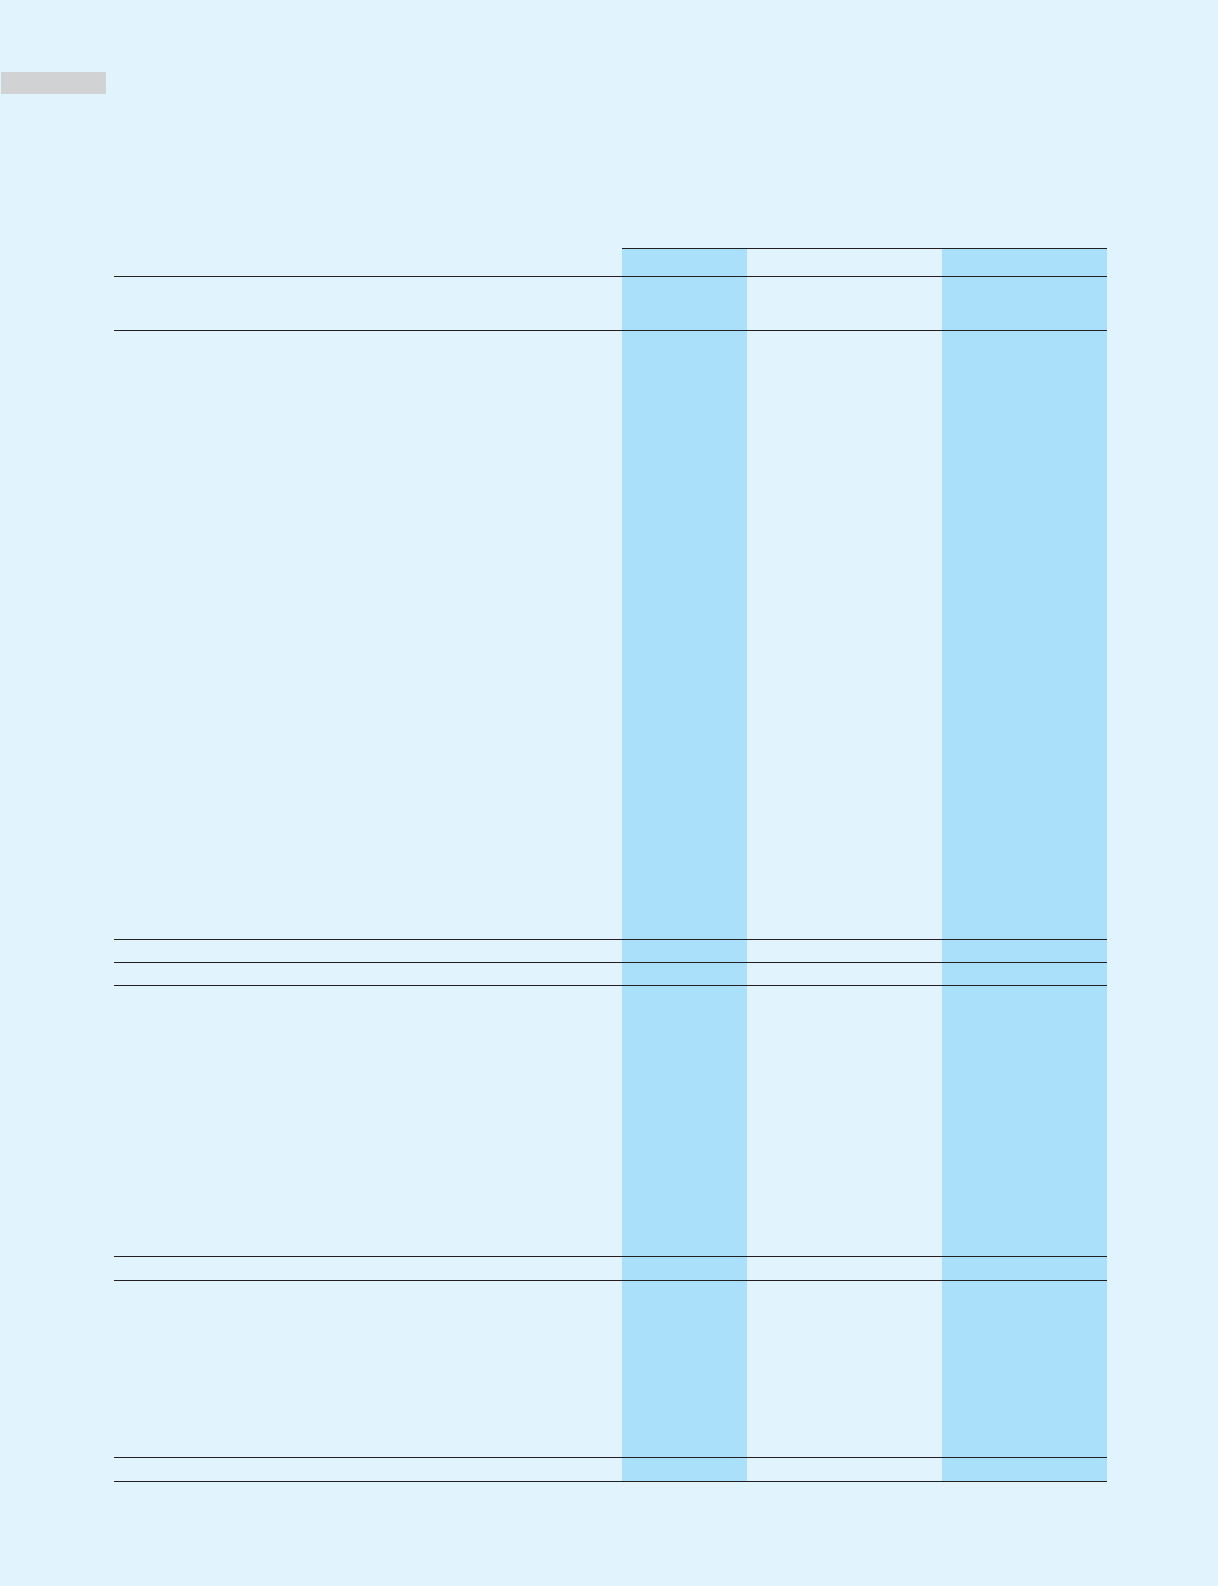
Consolidated Statements of Cash Flows
Hoya Corporation and Subsidiaries
Years Ended March 31, 2005, 2004 and 2003
Thousands of U.S. Dollars
Millions of Yen (Note 1)
2005 2004 2003 2005
OPERATING ACTIVITIES:
Income before income taxes and minority interests ¥ 83,466 ¥ 55,496 ¥ 28,743 $ 780,056
Adjustments for:
Income taxes—paid (23,588) (6,880) (11,509) (220,449)
Income taxes—refunded 330 3,900 3,084
Depreciation and amortization 21,661 19,988 19,792 202,439
Amortization of goodwill 3,300
Reversal of allowance for doubtful receivables (345) (1,169) (6) (3,224)
Provision for (reversal of) accrued bonuses to employees 194 191 (360) 1,813
Reversal of accrued retirement benefits (293) (7,256)
Provision for (reversal of) reserve for periodic repairs 185 94 (367) 1,729
Loss on write-down of investment securities 619 111
Gain on sales of property, plant and equipment and other assets (195) (523) (725) (1,822)
Loss on disposal of property, plant and equipment 948 1,900 1,947 8,860
Loss on impairment of long-lived assets 859 2,040 8,028
Foreign exchange loss (gain) (233) 1,209 706 (2,178)
Bonuses to directors (63) (169) (150) (589)
Equity in earnings of associated companies (3,708) (1,700) (418) (34,654)
Gain on transfer of business (488)
Other 554 507 740 5,178
Changes in assets and liabilities:
Decrease (increase) in notes and accounts receivable (5,393) (4,997) 628 (50,402)
Decrease (increase) in inventories (2,526) 222 3,208 (23,607)
Decrease (increase) in interest and dividends receivable (64) 101 (80) (598)
Decrease (increase) in other current assets 2,428 (1,961) 2,060 22,691
Increase (decrease) in notes and accounts payable (1,629) 5,116 555 (15,224)
Increase (decrease) in interest payable (23) 34 12 (215)
Increase in other current liabilities 3,142 1,719 1,247 29,364
Total adjustments (7,466) 23,248 9,647 (69,776)
Net cash provided by operating activities 76,000 78,744 38,390 710,280
INVESTING ACTIVITIES:
Proceeds from sales of investment securities 102 321
Purchases of investment securities (10) (379) (346) (93)
Proceeds from sales of property, plant and equipment 541 814 2,254 5,056
Purchases of property, plant and equipment (33,394) (23,212) (14,213) (312,093)
Collection of loans 211 2,169 111 1,972
Payment of loans (97) (2,475) (216) (907)
Purchase of goodwill (3,300)
Proceeds from transfer of business 894
Decrease in other assets 321 660 452 3,000
Increase in other assets (3,096) (2,718) (2,840) (28,935)
Net cash used in investing activities (35,524) (28,339) (13,583) (332,000)
FINANCING ACTIVITIES:
Net decrease in short-term bank loans (158) (1,738) (1,265) (1,477)
Repayments of long-term bank loans (161) (44) (434) (1,505)
Proceeds from sales of treasury stock 911 419 8,514
Payments for purchases of treasury stock (38) (32,921) (7,036) (355)
Dividends paid (12,246) (8,588) (5,813) (114,448)
Other 19
Net cash used in financing activities (11,692) (42,853) (14,548) (109,271)