Pentax 2005 Annual Report Download - page 69
Download and view the complete annual report
Please find page 69 of the 2005 Pentax annual report below. You can navigate through the pages in the report by either clicking on the pages listed below, or by using the keyword search tool below to find specific information within the annual report.-
 1
1 -
2
-
3
-
4
-
5
-
6
-
7
-
8
-
9
-
10
-
11
-
12
-
13
-
14
-
15
-
16
-
17
-
18
-
19
-
20
-
21
-
22
-
23
-
24
-
25
-
26
-
27
-
28
-
29
-
30
-
31
-
32
-
33
-
34
-
35
-
36
-
37
-
38
-
39
-
40
-
41
-
42
-
43
-
44
-
45
-
46
-
47
-
48
-
49
-
50
-
51
-
52
-
53
-
54
-
55
-
56
-
57
-
58
-
 59
59 -
 60
60 -
 61
61 -
 62
62 -
 63
63 -
 64
64 -
 65
65 -
 66
66 -
 67
67 -
 68
68 -
 69
69 -
 70
70 -
 71
71 -
 72
72 -
 73
73 -
 74
74 -
 75
75 -
 76
76 -
 77
77 -
 78
78 -
 79
79
 |
 |
66
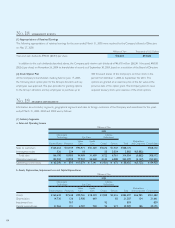
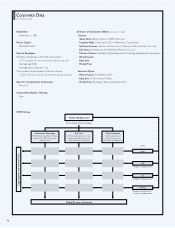
a. Sales and Operating Income
Millions of Yen
2003
Information Lifestyle
Technology Eye Care Refinement
Vision Health Eliminations
Electro-Optics Photonics Care Care Crystal Service Total and Corporate Consolidated
Sales to customers ¥111,461 ¥5,485 ¥94,388 ¥26,717 ¥6,719 ¥1,523 ¥246,293 ¥246,293
Intersegment sales 207 1,988 35 3,025 5,255 ¥(5,255)
Total sales 111,668 5,485 96,376 26,717 6,754 4,548 251,548 (5,255) 246,293
Operating expenses 77,254 6,073 80,978 21,628 6,766 4,309 197,008 (3,698) 193,310
Operating income (loss) ¥ 34,414 ¥ (588) ¥15,398 ¥ 5,089 ¥ (12) ¥ 239 ¥ 54,540 ¥(1,557) ¥ 52,983
b. Assets, Depreciation and Capital Expenditures
Millions of Yen
2003
Information Lifestyle
Technology Eye Care Refinement
Vision Health Eliminations
Electro-Optics Photonics Care Care Crystal Service Total and Corporate Consolidated
Assets ¥114,877 ¥2,698 ¥98,077 ¥16,447 ¥8,409 ¥2,432 ¥242,940 ¥31,349 ¥274,289
Depreciation 13,129 84 5,578 571 302 33 19,697 95 19,792
Capital expenditures 10,444 151 3,935 426 776 12 15,744 204 15,948
Notes: 1. The Company and subsidiaries primarily engage in the manufacture and sale of products in six major segments grouped on the basis of similarities in the types, nature and
market of the products. The six segments, namely, Electro-Optics, Photonics, Vision Care, Health Care, Crystal and Service, consist primarily of the following products:
Electro-Optics: Photomasks and mask blanks for semiconductors, masks for liquid-crystal display (LCD), parts for glass panels of LCD, glass disks for hard disk drives
(HDDs), optical lenses, optical glasses, electronic glasses, etc.
Photonics: Laser equipment, light sources for use in the electronics industry, special optical glass, etc.
Vision Care: Eyeglasses, eyeglass frames, ophthalmic equipment, etc.
Health Care: Contact lenses and related accessories, intraocular lenses, hearing aids, etc. On March 31, 2003, the hearing aids business was transferred to a third party.
Crystal: Crystal glass products
Service: Design of information systems, placement of temporary staff, outsourcing, etc.
2. Corporate operating expenses consist primarily of the administration expenses of the Company and regional headquarters, which are not allocated to industry segments.
Corporate operating expenses for the years ended March 31, 2005, 2004 and 2003 were ¥2,873 million ($26,850 thousand), ¥2,424 million and ¥2,052 million, respectively.
3. Corporate assets consist primarily of cash, time deposits, investments securities and administrative assets of the Company and the regional headquarters. Corporate assets
as of March 31, 2005, 2004 and 2003 were ¥75,076 million ($701,645 thousand), ¥52,594 million and ¥51,571 million, respectively.
4. Consolidated operating expenses are equal to the total of cost of sales and selling, general and administrative expenses shown in the accompanying consolidated statements
of income.
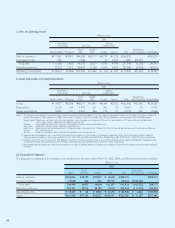
(2) Geographical Segments
The geographical segments of the Company and subsidiaries for the years ended March 31, 2005, 2004 and 2003 are summarized as follows:
Millions of Yen
2005
North Eliminations
Japan America Europe Asia Total and Corporate Consolidated
Sales to customers ¥230,946 ¥30,775 ¥33,803 ¥ 12,648 ¥308,172 ¥308,172
Interarea transfers 19,048 200 255 89,749 109,252 ¥(109,252)
Total sales 249,994 30,975 34,058 102,397 417,424 (109,252) 308,172
Operating expenses 204,413 30,912 28,195 71,004 334,524 (111,272) 223,252
Operating income ¥ 45,581 ¥ 63 ¥ 5,863 ¥ 31,393 ¥ 82,900 ¥ 2,020 ¥ 84,920
Assets ¥165,938 ¥17,129 ¥32,927 ¥104,191 ¥320,185 ¥ 31,297 ¥351,482