Pentax 2005 Annual Report Download - page 41
Download and view the complete annual report
Please find page 41 of the 2005 Pentax annual report below. You can navigate through the pages in the report by either clicking on the pages listed below, or by using the keyword search tool below to find specific information within the annual report.-
 1
1 -
2
-
3
-
4
-
5
-
6
-
7
-
8
-
9
-
10
-
11
-
12
-
13
-
14
-
15
-
16
-
17
-
18
-
19
-
20
-
21
-
22
-
23
-
24
-
25
-
26
-
27
-
28
-
29
-
30
-
 31
31 -
 32
32 -
 33
33 -
 34
34 -
 35
35 -
 36
36 -
 37
37 -
 38
38 -
 39
39 -
 40
40 -
 41
41 -
 42
42 -
 43
43 -
 44
44 -
 45
45 -
 46
46 -
 47
47 -
 48
48 -
 49
49 -
 50
50 -
 51
51 -
52
-
53
-
54
-
55
-
56
-
57
-
58
-
59
-
60
-
61
-
62
-
63
-
64
-
65
-
66
-
67
-
68
-
69
-
70
-
71
-
72
-
73
-
74
-
75
-
76
-
77
-
78
-
79
 |
 |

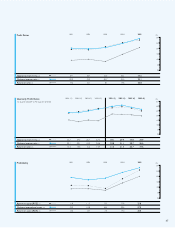
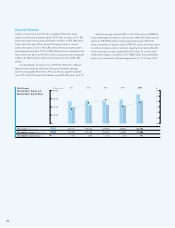
Net sales of the Vision Care division declined 3.3% to ¥94,971 million. In
the domestic eyeglass lens market, the prolonged slump appears to
have hit bottom, and the trend toward moderate recovery continued,
with demand recovering for high-value-added products. Although sharp
price competition for low-priced products continued, Hoya increased
net sales by emphasizing sales of high-value-added products. In overseas
markets, on the other hand, net sales were sharply affected by a sluggish
market overall in Germany, the largest market for Hoya in Europe,
where sales fell in reaction to increased demand stimulated by reform
of the health insurance system in the previous consolidated fiscal year.
Under these circumstances, Hoya is pursuing a differentiation strategy
by selling high-value-added products such as high-index lenses and
highly functioned coatings in both the domestic and overseas markets.
Operating income for the Vision Care division decreased 2.4% to
¥17,079 million, while the operating margin was 18.0%, 0.2 percentage
point higher than in the previous consolidated fiscal year. Profitability
rose because of measures such as emphasis on high-value-added
products and a review of the production organization on a global basis.
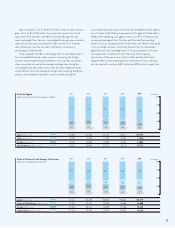
Although the position of the circle for this division was lower on the
graph because net sales declined, affected mainly by the slump in the
European market, the circle shifted to the right somewhat because the
profit margin rose slightly. By quarter, the operating margin was 17.3% in
the first quarter, 17.4% in the second quarter, 20.1% in the third quarter
and 17.2% in the fourth quarter.
Capital investment in the Vision Care division decreased by 1.9% to
¥6,787 million. During the consolidated fiscal year under review, Hoya
continued to build a global production organization with a focus on
optimal production locations.
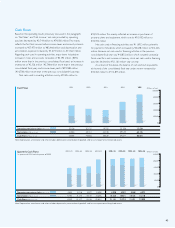
Eye Care (Vision Care Division)
(%)
40
20
0
(Millions of yen)
100,000
80,000
60,000
40,000
20,000
0
2003 2004 2005
Net sales (Millions of yen)
Operating income (Millions of yen)
Operating income ratio* (%)
Assets (Millions of yen)
Depreciation (Millions of yen)
Capital expenditures (Millions of yen)
94,388
15,398
16.0
98,077
5,578
3,935
98,203
17,496
17.8
92,082
5,735
6,916
94,971
17,079
18.0
90,765
5,900
6,787
(%)
40
20
0
(Millions of yen)
35,000
30,000
25,000
20,000
15,000
10,000
5,000
0
2003 2004 2005
Net sales (Millions of yen)
Operating income (Millions of yen)
Operating income ratio* (%)
Assets (Millions of yen)
Depreciation (Millions of yen)
Capital expenditures (Millions of yen)
26,717
5,089
19.0
16,447
571
426
28,381
6,273
22.1
18,873
532
1,201
31,409
7,141
22.7
18,330
669
738
* The operating income ratio above is calculated using net sales plus intersegment
sales. Please refer to details on page 64 Segment Information.
* The operating income ratio above is calculated using net sales plus intersegment
sales. Please refer to details on page 64 Segment Information.
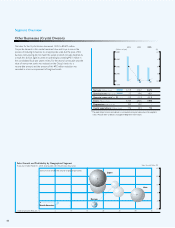
Net sales for the Health Care division grew 10.7% to ¥31,409 million. In
contact lenses, within the context of continued price competition in the
market from discount retailers, Hoya sought to increase its
attractiveness to customers by aggressively pursuing scrap and build of
directly managed Eye City stores, and boosted net sales as a result of
offering customer services with a high level of professional expertise
and promoting multifocal lenses and other high-value-added products.
Net sales for IOLs also expanded strongly, as Hoya continued sales of
soft intraocular lenses and began selling yellow lenses and injectors, and
aggressively pursued business development not only in the domestic
market but also in overseas markets.
Operating income for the Health Care division increased 13.9% to
¥7,141 million. The full year operating margin improved by 0.6
percentage point to 22.7%. In addition to pursuing efficient
management, Hoya focused on further expansion of the business and
invested aggressively in product development and marketing.
On the graph, the position of the circle has shifted upward to the
right side. This shows that the division grew from the perspective of
both sales growth and profitability, although it lies slightly below the
consolidated average growth rate for net sales of 13.5%. By quarter, the
operating margin was 23.8% in the first quarter, 24.6% in the second
quarter, 21.9% in the third quarter and 20.6% in the fourth quarter.
Eye Care (Health Care Division)