Pentax 2005 Annual Report Download - page 64
Download and view the complete annual report
Please find page 64 of the 2005 Pentax annual report below. You can navigate through the pages in the report by either clicking on the pages listed below, or by using the keyword search tool below to find specific information within the annual report.-
 1
1 -
2
-
3
-
4
-
5
-
6
-
7
-
8
-
9
-
10
-
11
-
12
-
13
-
14
-
15
-
16
-
17
-
18
-
19
-
20
-
21
-
22
-
23
-
24
-
25
-
26
-
27
-
28
-
29
-
30
-
31
-
32
-
33
-
34
-
35
-
36
-
37
-
38
-
39
-
40
-
41
-
42
-
43
-
44
-
45
-
46
-
47
-
48
-
49
-
50
-
51
-
52
-
53
-
 54
54 -
 55
55 -
 56
56 -
 57
57 -
 58
58 -
 59
59 -
 60
60 -
 61
61 -
 62
62 -
 63
63 -
 64
64 -
 65
65 -
 66
66 -
 67
67 -
 68
68 -
 69
69 -
 70
70 -
 71
71 -
 72
72 -
 73
73 -
 74
74 -
75
-
76
-
77
-
78
-
79
 |
 |
61
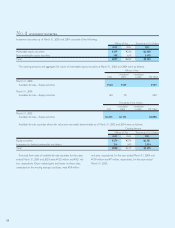
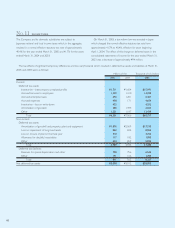
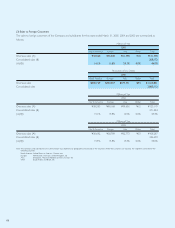
A reconciliation between the normal effective statutory tax rates and the actual effective tax rates reflected in the accompanying
consolidated statements of income for the years ended March 31, 2005, 2004 and 2003 was as follows:
2005 2004 2003
Normal effective statutory tax rate 40.4% 41.7% 41.7%
Lower income tax rates applicable to income in certain foreign countries (13.8) (12.4) (13.5)
Expenses not permanently deductible for income tax purposes 0.4 0.7 0.6
Per capita portion 0.1 0.2 0.4
Non-taxable dividend income (2.6) (2.1) (2.1)
Intercompany cash dividend and transactions 0.8 1.6 2.1
Equity in earnings of associated companies (1.8) (1.2) (0.6)
Special tax credit on experiment and research expenses (0.8) (1.1)
Adjustments of deferred tax assets and liabilities due to change the normal effective
statutory tax rate 0.3
Other—net 0.3 1.1 1.3
Actual effective tax rate 23.0% 28.5% 30.2%
Research and development expenses charged to income for
the years ended March 31, 2005, 2004 and 2003 were ¥10,957
million ($102,402 thousand), ¥9,847 million and ¥8,681 million,
respectively.
No. 12 RESEARCH AND DEVELOPMENT EXPENSES
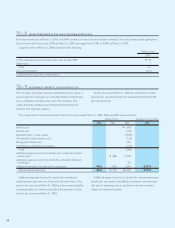
The Group leases certain machinery, computer equipment, office
space and other assets. Total rental expenses including lease
payments for the years ended March 31, 2005, 2004 and 2003
were ¥5,802 million ($54,224 thousand), ¥6,748 million and
¥7,967 million, respectively. For the year ended March 31, 2004,
the Group recorded an impairment loss of ¥276 million on certain
leased property held under finance leases that do not transfer
ownership and an allowance for impairment loss on leased
property, which is included in current liabilities.
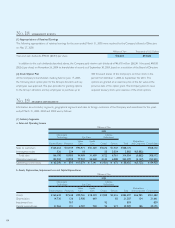
No. 13 LEASES
Pro forma information of leased property such as acquisition cost, accumulated depreciation, accumulated impairment loss, obligation
under finance lease and depreciation expense of finance leases that do not transfer ownership of the leased property to the lessee on an
“as if capitalized” basis for the years ended March 31, 2005 and 2004 was as follows:
Millions of Yen Thousands of U.S. Dollars
2005 2004 2005
Machinery Furniture Machinery Furniture Machinery Furniture
and and and and and and
Vehicles Equipment Total Vehicles Equipment Total Vehicles Equipment Total
Acquisition cost ¥3,796 ¥2,409 ¥6,205 ¥4,064 ¥3,277 ¥7,341 $35,477 $22,514 $57,991
Accumulated depreciation 2,191 1,667 3,858 2,037 2,201 4,238 20,477 15,579 36,056
Accumulated impairment loss 203 203 276 276 1,897 1,897
Net leased property ¥1,605 ¥ 539 ¥2,144 ¥2,027 ¥ 800 ¥2,827 $15,000 $ 5,038 $20,038