Pentax 2005 Annual Report Download - page 42
Download and view the complete annual report
Please find page 42 of the 2005 Pentax annual report below. You can navigate through the pages in the report by either clicking on the pages listed below, or by using the keyword search tool below to find specific information within the annual report.-
 1
1 -
2
-
3
-
4
-
5
-
6
-
7
-
8
-
9
-
10
-
11
-
12
-
13
-
14
-
15
-
16
-
17
-
18
-
19
-
20
-
21
-
22
-
23
-
24
-
25
-
26
-
27
-
28
-
29
-
30
-
31
-
 32
32 -
 33
33 -
 34
34 -
 35
35 -
 36
36 -
 37
37 -
 38
38 -
 39
39 -
 40
40 -
 41
41 -
 42
42 -
 43
43 -
 44
44 -
 45
45 -
 46
46 -
 47
47 -
 48
48 -
 49
49 -
 50
50 -
 51
51 -
 52
52 -
53
-
54
-
55
-
56
-
57
-
58
-
59
-
60
-
61
-
62
-
63
-
64
-
65
-
66
-
67
-
68
-
69
-
70
-
71
-
72
-
73
-
74
-
75
-
76
-
77
-
78
-
79
 |
 |
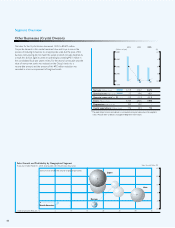
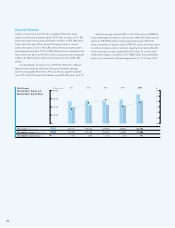
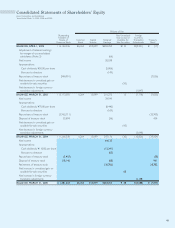
Net sales for the Crystal division decreased 15.0% to ¥3,672 million.
Corporate demand in this market remained slow, and Hoya is now in the
process of reducing its business to an appropriate scale, but the pace of the
business restructuring did not match the speed at which net sales declined. As
a result, this division again incurred an operating loss, totaling ¥421 million in
the consolidated fiscal year under review. For the second consecutive year, the
value of noncurrent assets was reduced on the Group’s books to a
recoverable amount, and the amount of this ¥92 million reduction was
recorded as a loss on impairment of long-lived assets.
Segment Overview
Other Businesses (Crystal Division)
(%)
12
6
0
-6
-12
(Millions of yen)
8,000
6,000
4,000
2,000
0
-1000
2003 2004 2005
Net sales (Millions of yen)
Operating income (Millions of yen)
Operating income ratio* (%)
Assets (Millions of yen)
Depreciation (Millions of yen)
Capital expenditures (Millions of yen)
6,719
-12
-0.2
8,409
302
776
4,322
-496
-11.3
2,805
352
224
3,672
-421
-11.3
1,900
-
92
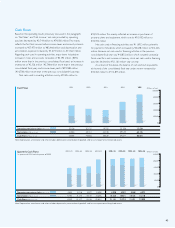
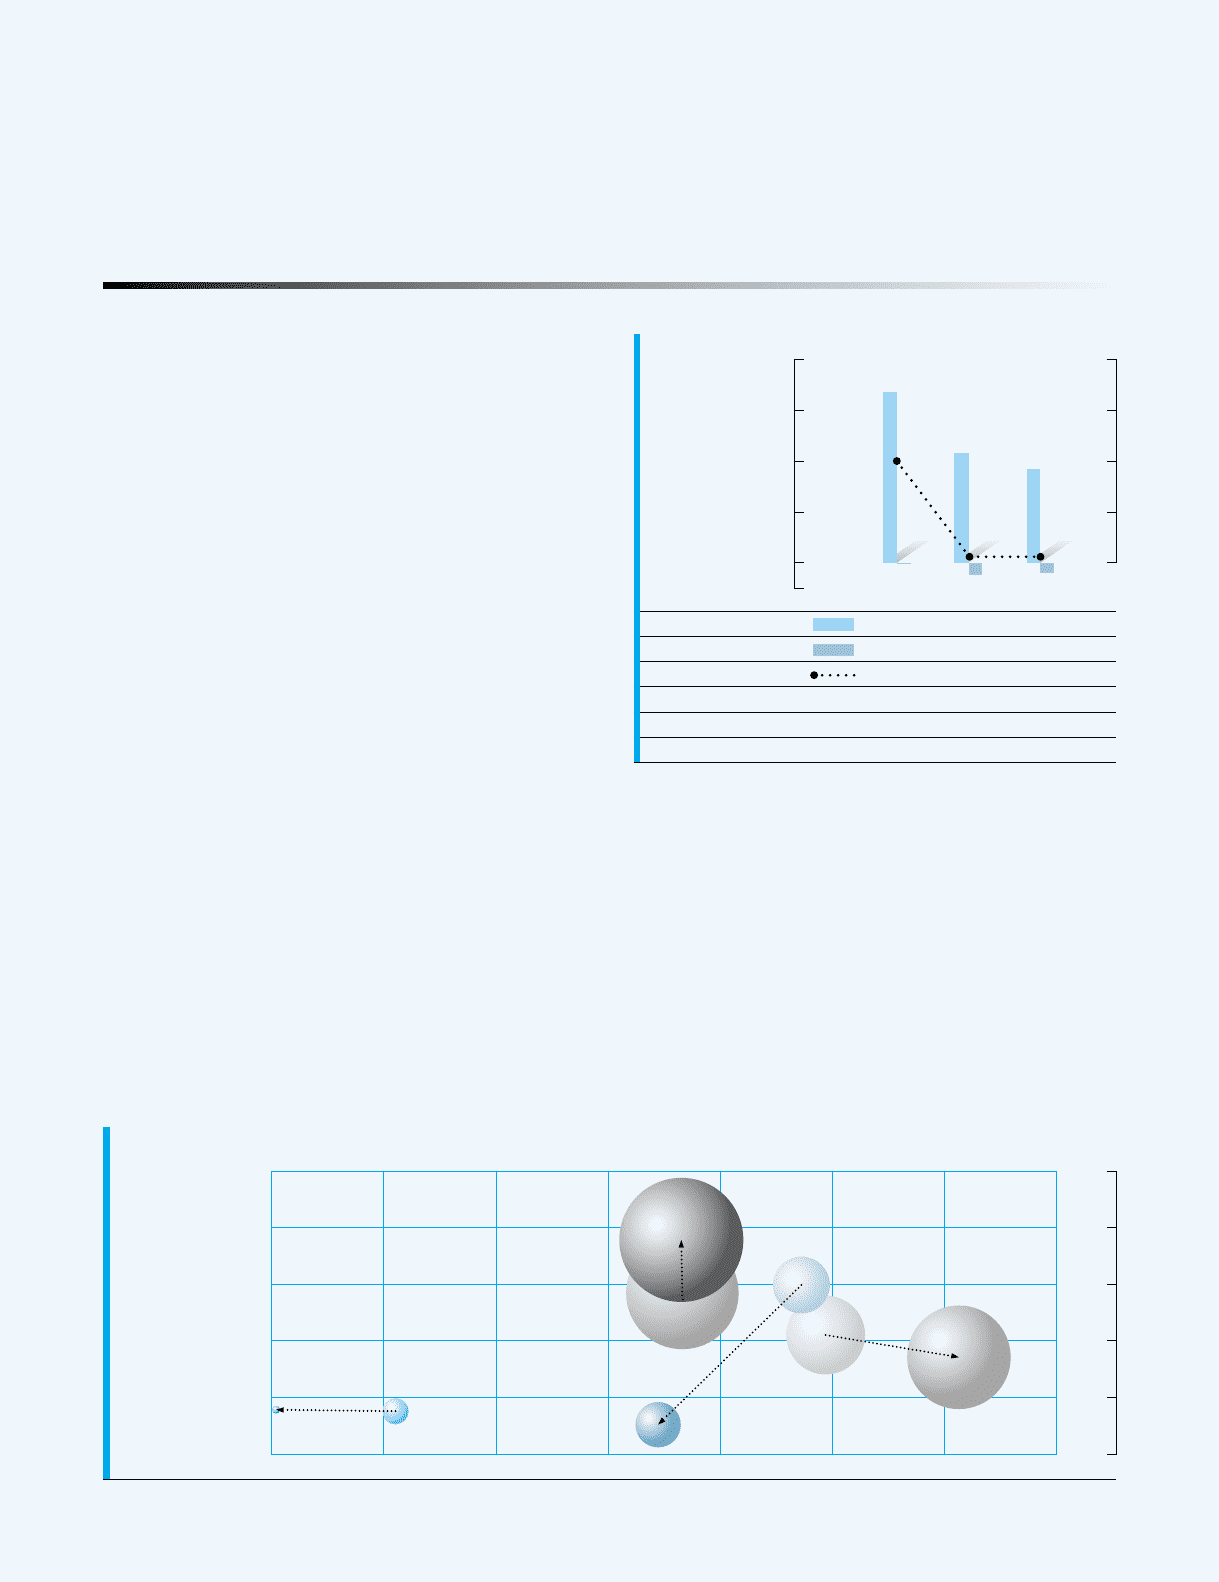
Sales Growth and Profitability by Geographical Segment
Fiscal year ended March 31, 2005 (Compared with the previous fiscal year) Sales Growth Ratio (%)
35
25
15
5
-5
-15
05 101520 253035
Japan
North America
* The operating income ratio above is calculated using net sales plus intersegment
sales. Please refer to details on page 64 Segment Information.
Operating Income Ratio (%)
Asia
Europe
Size of circle shows the volume of operating income.