Pentax 2005 Annual Report Download - page 68
Download and view the complete annual report
Please find page 68 of the 2005 Pentax annual report below. You can navigate through the pages in the report by either clicking on the pages listed below, or by using the keyword search tool below to find specific information within the annual report.-
 1
1 -
2
-
3
-
4
-
5
-
6
-
7
-
8
-
9
-
10
-
11
-
12
-
13
-
14
-
15
-
16
-
17
-
18
-
19
-
20
-
21
-
22
-
23
-
24
-
25
-
26
-
27
-
28
-
29
-
30
-
31
-
32
-
33
-
34
-
35
-
36
-
37
-
38
-
39
-
40
-
41
-
42
-
43
-
44
-
45
-
46
-
47
-
48
-
49
-
50
-
51
-
52
-
53
-
54
-
55
-
56
-
57
-
 58
58 -
 59
59 -
 60
60 -
 61
61 -
 62
62 -
 63
63 -
 64
64 -
 65
65 -
 66
66 -
 67
67 -
 68
68 -
 69
69 -
 70
70 -
 71
71 -
 72
72 -
 73
73 -
 74
74 -
 75
75 -
 76
76 -
 77
77 -
 78
78 -
79
 |
 |
65
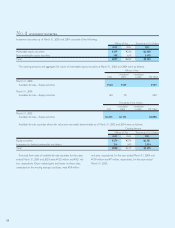
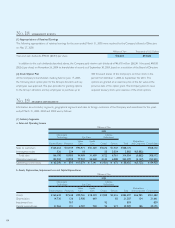
a. Sales and Operating Income
Thousands of U.S. Dollars
2005
Information Lifestyle
Technology Eye Care Refinement
Vision Health Eliminations
Electro-Optics Photonics Care Care Crystal Service Total and Corporate Consolidated
Sales to customers $1,548,262 $100,458 $887,579 $293,542 $34,318 $15,953 $2,880,112 $2,880,112
Intersegment sales 4,916 2,187 168 467 47,234 54,972 $(54,972)
Total sales 1,553,178 102,645 887,747 293,542 34,785 63,187 2,935,084 (54,972) 2,880,112
Operating expenses 961,682 94,299 728,131 226,804 38,720 56,897 2,106,533 (20,066) 2,086,467
Operating income (loss) $ 591,496 $ 8,346 $159,616 $ 66,738 $ (3,935) $ 6,290 $ 828,551 $(34,906) $ 793,645
b. Assets, Depreciation, Impairment Loss and Capital Expenditures
Thousands of U.S. Dollars
2005
Information Lifestyle
Technology Eye Care Refinement
Vision Health Eliminations
Electro-Optics Photonics Care Care Crystal Service Total and Corporate Consolidated
Assets $1,519,981 $71,477 $848,271 $171,309 $17,757 $30,056 $2,658,851 $626,028 $3,284,879
Depreciation 137,664 1,178 55,140 6,252 766 201,000 1,439 202,439
Impairment loss 7,168 860 8,028 8,028
Capital expenditures 298,710 1,785 63,430 6,897 860 2,047 373,729 1,738 375,467
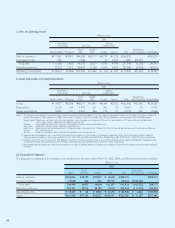
a. Sales and Operating Income
Millions of Yen
2004
Information Lifestyle
Technology Eye Care Refinement
Vision Health Eliminations
Electro-Optics Photonics Care Care Crystal Service Total and Corporate Consolidated
Sales to customers ¥135,071 ¥4,116 ¥98,203 ¥28,381 ¥4,322 ¥1,351 ¥271,444 ¥271,444
Intersegment sales 81 18 62 5,804 5,965 ¥(5,965)
Total sales 135,152 4,116 98,221 28,381 4,384 7,155 277,409 (5,965) 271,444
Operating expenses 89,982 4,193 80,725 22,108 4,880 6,547 208,435 (5,158) 203,277
Operating income (loss) ¥ 45,170 ¥ (77) ¥17,496 ¥ 6,273 ¥ (496) ¥ 608 ¥ 68,974 ¥ (807) ¥ 68,167
b. Assets, Depreciation, Impairment Loss and Capital Expenditures
Millions of Yen
2004
Information Lifestyle
Technology Eye Care Refinement
Vision Health Eliminations
Electro-Optics Photonics Care Care Crystal Service Total and Corporate Consolidated
Assets ¥132,240 ¥1,748 ¥92,082 ¥18,873 ¥2,805 ¥2,797 ¥250,545 ¥39,342 ¥289,887
Depreciation 13,205 59 5,735 532 352 30 19,913 75 19,988
Impairment loss 2,040 2,040 2,040
Capital expenditures 22,247 36 6,916 1,201 224 14 30,638 21 30,659