Pentax 2005 Annual Report Download - page 40
Download and view the complete annual report
Please find page 40 of the 2005 Pentax annual report below. You can navigate through the pages in the report by either clicking on the pages listed below, or by using the keyword search tool below to find specific information within the annual report.-
 1
1 -
2
-
3
-
4
-
5
-
6
-
7
-
8
-
9
-
10
-
11
-
12
-
13
-
14
-
15
-
16
-
17
-
18
-
19
-
20
-
21
-
22
-
23
-
24
-
25
-
26
-
27
-
28
-
29
-
 30
30 -
 31
31 -
 32
32 -
 33
33 -
 34
34 -
 35
35 -
 36
36 -
 37
37 -
 38
38 -
 39
39 -
 40
40 -
 41
41 -
 42
42 -
 43
43 -
 44
44 -
 45
45 -
 46
46 -
 47
47 -
 48
48 -
 49
49 -
 50
50 -
51
-
52
-
53
-
54
-
55
-
56
-
57
-
58
-
59
-
60
-
61
-
62
-
63
-
64
-
65
-
66
-
67
-
68
-
69
-
70
-
71
-
72
-
73
-
74
-
75
-
76
-
77
-
78
-
79
 |
 |

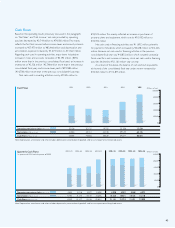
Net sales in the Electro-Optics division rose 22.6% year on year to ¥165,664
million. In mask blanks for semiconductor production, demand was strong for
high-precision products such as phase shift mask blanks in response to steady
growth in high-precision products for the semiconductor market. Sales of
photomasks for semiconductor production increased as a result of robust
demand throughout the year for high-precision products and next-generation
products for R&D. In large-scale LCD photomasks, the market grew severe as
price reductions were implemented in the market for LCD panels during the
second half of the year. With demand for LCD televisions expanding and LCD
panel manufacturers continuing to launch new models, however, demand for
masks remained strong and net sales were steady, centered on masks for
large-scale panels.
In glass disks for HDDs, in addition to steady demand for disks for laptop
computers, demand for small-size glass disks for applications such as portable
music players expanded strongly. Net sales were also boosted substantially
compared to the previous consolidated fiscal year by the addition of the glass
disk business of NIPPON SHEET GLASS CO., LTD., which was transferred to
Hoya in March 2004. In optical glass products, sales of molded aspheric lenses
and other optical lenses fared well, reflecting growth in the digital camera
market in the first half of the consolidated fiscal year under review. Although
affected greatly by inventory adjustments because of oversupply in the market
during the second half, net sales increased year on year for the full year.
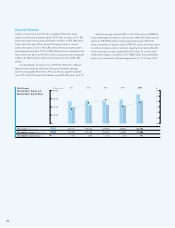
Operating income of the Electro-Optics division rose 40.1% to ¥63,290
million. In the first half, conditions of strong demand relative to supply capacity
continued for many products, boosting profit margins to very high levels
because plant capacity utilization rates were high. Hoya expanded supply
capacity in the second half of the year through capital investment, but demand
for some products slowed, causing profit margins to erode. Throughout the
year, demand for high-value-added products was strong for every product, and
the operating margin for the full year increased by 4.7 percentage points to
38.1%.
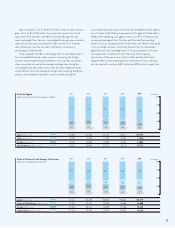
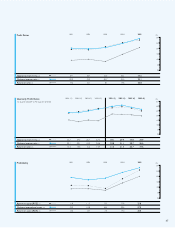
As indicated in the graph for “Sales Growth and Profitability by Business
Segment” (“the graph”), the growth rate for Electro-Optics division net sales
was higher than the consolidated average growth rate for net sales of 13.5%
(the circle is above the Consolidated Basis line), and the position of the circle
shifted right as the operating margin improved from the previous consolidated
fiscal year.
By quarter, the operating margin was 38.9% in the first quarter, 40.5% in
the second quarter, 37.3% in the third quarter and 35.5% in the fourth quarter.
Hoya increased capital investment in the Electro-Optics division
substantially during the fiscal year, boosting investment by 43.7% to ¥31,962
million. Capital investments to construct new plants and enhance existing
equipment were made to improve production capacity for products such as
large-scale LCD photomasks, glass disks for HDDs and optical lenses.
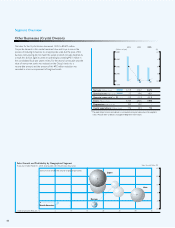
Net sales for the Photonics division jumped 161.2% to ¥10,749 million.
The main factor behind this net sales increase was the transfer of HOYA
CANDEO OPTRONICS CORPORATION, which was part of the Electro-
Optics division until the end of the previous consolidated fiscal year, to the
Photonics division at the start of the consolidated fiscal year under review. At
the end of the first quarter of the previous consolidated fiscal year, this
company was converted from a company accounted for by the equity
method to a consolidated subsidiary.
Segment Overview
Information Technology (Electro-Optics and Photonics Division)
(%)
40
20
0
(Millions of yen)
200,000
150,000
100,000
50,000
0
2003 2004 2005
Net sales (Millions of yen)
Operating income (Millions of yen)
Operating income ratio* (%)
Assets (Millions of yen)
Depreciation (Millions of yen)
Capital expenditures (Millions of yen)
111,461
34,414
30.8
114,877
13,129
10,444
135,071
45,170
33.4
132,240
13,205
22,247
165,664
63,290
38.1
162,638
14,730
31,962
Sales Growth and Profitability by Business Segment
Fiscal year ended March 31, 2005 (Compared with the previous fiscal year) Sales Growth Ratio (%)
35
25
15
5
-5
-15
1520253035 4045
* The operating income ratio above is calculated using net sales plus intersegment
sales. Please refer to details on page 64 Segment Information.
Electro-Optics Division
Operating Income Ratio (%)
Electro-Optics
Health Care
Vision Care
Size of circle shows the volume of operating income.
Consolidated Basis
Consolidated Basis