Pentax 2005 Annual Report Download - page 39
Download and view the complete annual report
Please find page 39 of the 2005 Pentax annual report below. You can navigate through the pages in the report by either clicking on the pages listed below, or by using the keyword search tool below to find specific information within the annual report.-
 1
1 -
2
-
3
-
4
-
5
-
6
-
7
-
8
-
9
-
10
-
11
-
12
-
13
-
14
-
15
-
16
-
17
-
18
-
19
-
20
-
21
-
22
-
23
-
24
-
25
-
26
-
27
-
28
-
 29
29 -
 30
30 -
 31
31 -
 32
32 -
 33
33 -
 34
34 -
 35
35 -
 36
36 -
 37
37 -
 38
38 -
 39
39 -
 40
40 -
 41
41 -
 42
42 -
 43
43 -
 44
44 -
 45
45 -
 46
46 -
 47
47 -
 48
48 -
 49
49 -
50
-
51
-
52
-
53
-
54
-
55
-
56
-
57
-
58
-
59
-
60
-
61
-
62
-
63
-
64
-
65
-
66
-
67
-
68
-
69
-
70
-
71
-
72
-
73
-
74
-
75
-
76
-
77
-
78
-
79
 |
 |

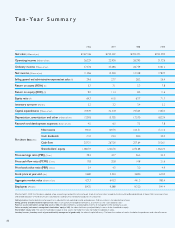
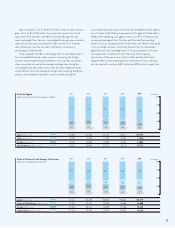
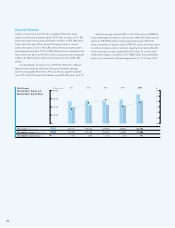
Profit Ratios (%)
30
25
20
15
10
5
0
2001 2002 2003 2004 2005
Operating income ratio (%)
Ordinary income ratio (%)
Return on sales (%)
19.1
20.3
9.2
18.7
19.5
10.1
21.5
20.7
8.1
25.1
24.5
14.6
27.6
29.1
20.8
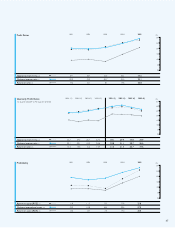
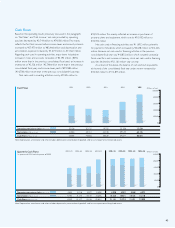
Profitability (%)
30
25
20
15
10
5
0
2001 2002 2003 2004 2005
Return on equity [ROE] (%)
Ordinary income/total assets (%)
Return on assets [ROA] (%)
11.8
19.0
8.6
11.5
16.8
8.7
9.0
18.4
7.3
17.8
23.6
14.0
25.8
27.9
20.0
Quarterly Profit Ratios
1st quarter of 2004 to 4th quarter of 2005
(%)
35
30
25
20
15
10
5
0
2004-1Q 2004-2Q 2004-3Q 2004-4Q 2005-1Q 2005-2Q 2005-3Q 2005-4Q
Operating income ratio (%)
Ordinary income ratio (%)
Return on sales (%)
22.7
23.1
15.3
24.2
23.1
13.5
25.7
24.9
15.2
27.5
26.8
14.4
28.1
29.8
21.6
29.4
31.1
21.3
27.8
28.7
20.7
24.9
26.6
19.6