Pentax 2005 Annual Report Download - page 45
Download and view the complete annual report
Please find page 45 of the 2005 Pentax annual report below. You can navigate through the pages in the report by either clicking on the pages listed below, or by using the keyword search tool below to find specific information within the annual report.-
 1
1 -
2
-
3
-
4
-
5
-
6
-
7
-
8
-
9
-
10
-
11
-
12
-
13
-
14
-
15
-
16
-
17
-
18
-
19
-
20
-
21
-
22
-
23
-
24
-
25
-
26
-
27
-
28
-
29
-
30
-
31
-
32
-
33
-
34
-
 35
35 -
 36
36 -
 37
37 -
 38
38 -
 39
39 -
 40
40 -
 41
41 -
 42
42 -
 43
43 -
 44
44 -
 45
45 -
 46
46 -
 47
47 -
 48
48 -
 49
49 -
 50
50 -
 51
51 -
 52
52 -
 53
53 -
 54
54 -
 55
55 -
56
-
57
-
58
-
59
-
60
-
61
-
62
-
63
-
64
-
65
-
66
-
67
-
68
-
69
-
70
-
71
-
72
-
73
-
74
-
75
-
76
-
77
-
78
-
79
 |
 |
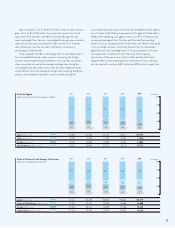
Depreciation, amortization and other (Millions of yen)
Net income (Millions of yen)
Cash flows (Millions of yen)
32,138
21,860
53,998
20,105
23,741
43,846
19,792
20,038
39,830
25,328
39,549
64,877
22,520
64,135
86,655
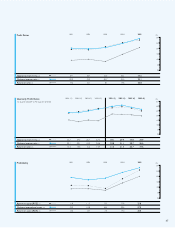
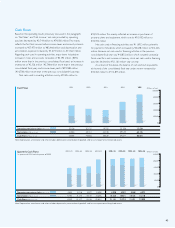
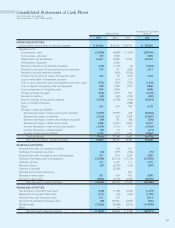
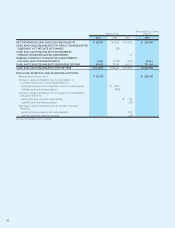
Cash Flows
Based on the operating results previously discussed in the paragraphs
on “Net Sales” and “Net Income,” net cash provided by operating
activities decreased by ¥2,744 million to ¥76,000 million. This mainly
reflects the fact that income before income taxes and minority interests
increased by ¥27,970 million to ¥83,466 million and depreciation and
amortization expense increased by ¥1,673 million to ¥21,661 million.
Regarding cash used in operating activities, major items included an
increase in notes and accounts receivable of ¥5,393 million (¥396
million more than in the previous consolidated fiscal year) an increase in
inventories of ¥2,526 million (¥2,748 million more than in the previous
consolidated fiscal year) and income taxes paid of ¥23,588 million
(¥16,708 million more than in the previous consolidated fiscal year).
Net cash used in investing activities rose by ¥7,185 million to
¥35,524 million. This mainly reflected an increase in purchases of
property, plant and equipment, which rose by ¥10,182 million to
¥33,394 million.
Net cash used in financing activities was ¥11,692 million, primarily
for payment of dividends, which increased by ¥3,658 million to ¥12,246
million. Because net cash used in financing activities in the previous
consolidated fiscal year was ¥42,853 million, which included substantial
funds used for a net increase in treasury stock, net cash used in financing
activities declined by ¥31,161 million year on year.
As a result of the above, the balance of cash and cash equivalents
at the end of the consolidated fiscal year under review increased by
¥32,450 million to ¥112,875 million.
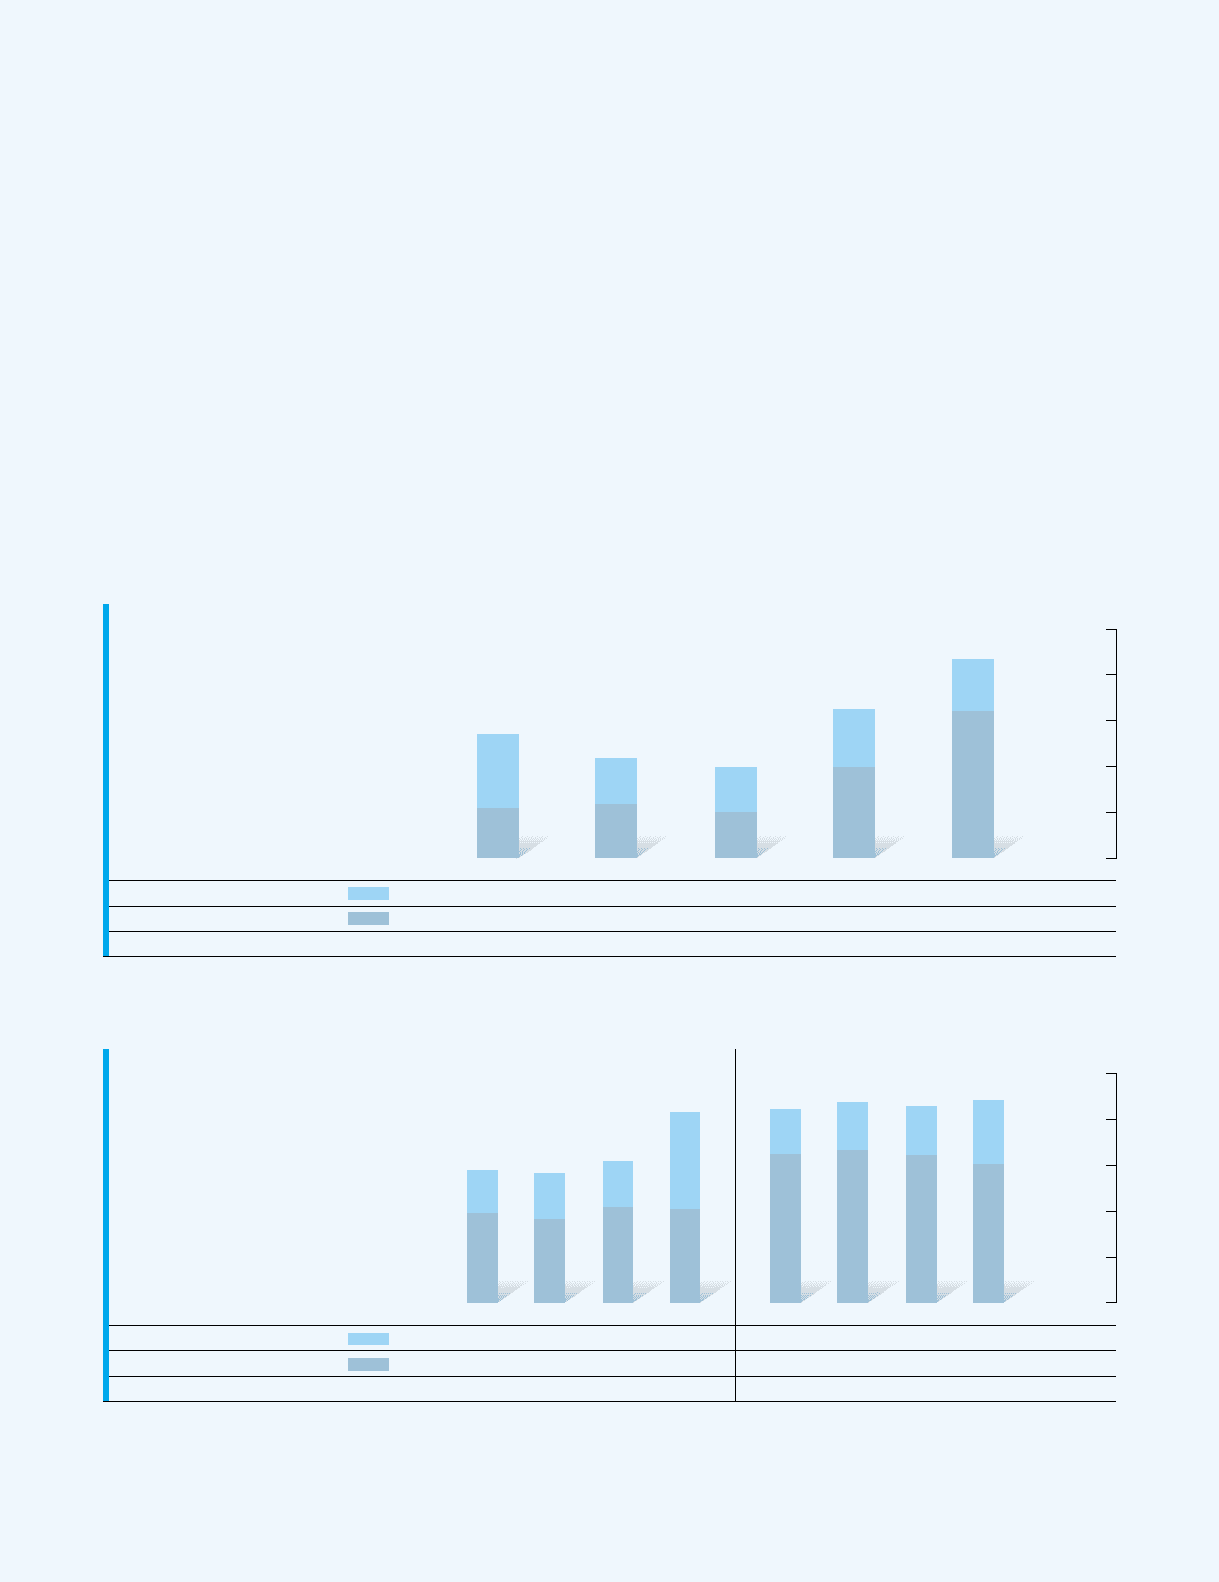
Cash Flows (Millions of yen)
100,000
80,000
60,000
40,000
20,000
0
2001 2002 2003 2004 2005
Quarterly Cash Flows
1st quarter of 2004 to 4th quarter of 2005
(Millions of yen)
25,000
20,000
15,000
10,000
5,000
0
2004-1Q 2004-2Q 2004-3Q 2004-4Q 2005-1Q 2005-2Q 2005-3Q 2005-4Q
Depreciation, amortization and other (Millions of yen)
Net income (Millions of yen)
Cash flows (Millions of yen)
4,645
9,795
14,440
5,018
9,129
14,147
5,027
10,419
15,446
10,638
10,206
20,844
4,928
16,223
21,151
5,252
16,671
21,923
5,368
16,123
21,491
6,972
15,118
22,090
Note: Depreciation, amortization and other includes depreciation, amortization of goodwill, and loss on impairment of long-lived assets.
Note: Depreciation, amortization and other includes depreciation, amortization of goodwill, and loss on impairment of long-lived assets.