Pentax 2005 Annual Report Download - page 34
Download and view the complete annual report
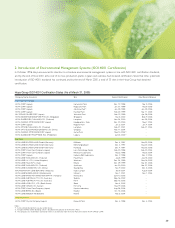
Please find page 34 of the 2005 Pentax annual report below. You can navigate through the pages in the report by either clicking on the pages listed below, or by using the keyword search tool below to find specific information within the annual report.-
 1
1 -
2
-
3
-
4
-
5
-
6
-
7
-
8
-
9
-
10
-
11
-
12
-
13
-
14
-
15
-
16
-
17
-
18
-
19
-
20
-
21
-
22
-
23
-
 24
24 -
 25
25 -
 26
26 -
 27
27 -
 28
28 -
 29
29 -
 30
30 -
 31
31 -
 32
32 -
 33
33 -
 34
34 -
 35
35 -
 36
36 -
 37
37 -
 38
38 -
 39
39 -
 40
40 -
 41
41 -
 42
42 -
 43
43 -
 44
44 -
45
-
46
-
47
-
48
-
49
-
50
-
51
-
52
-
53
-
54
-
55
-
56
-
57
-
58
-
59
-
60
-
61
-
62
-
63
-
64
-
65
-
66
-
67
-
68
-
69
-
70
-
71
-
72
-
73
-
74
-
75
-
76
-
77
-
78
-
79
 |
 |

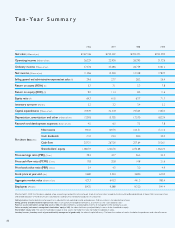
Effective April 1, 2002, the Company adopted a new accounting standard for net income per share of common stock issued by the Accounting Standards Board of Japan. Net income per share
and related data prior to that date are also calculated according to the standard for purposes of comparison.
Ordinary income: Income before income taxes that is adjusted for non-operating income and expenses. Ordinary income is not reported net of taxes.
Selling, general and administrative expenses/net sales: A calculation of management efficiency, also known as the ”sales expense ratio.“
Return on assets (net income/ average total assets x 100): An index of efficiency and profitability in terms of management of the Company’s assets.
Return on equity (net income/ average total shareholders’ equity x 100): An index of efficiency and profitability in terms of the shareholders’ equity.
Shareholders’ equity ratio: The ratio of shareholders’ equity to total assets; the higher the ratio, the higher the degree of safety.
Inventory turnover (inventory assets at year-end/monthly average cost of goods sold): An index of capital efficiency. The fewer the number of months, the better the production and sales efficiencies.
Ten-Year Summary
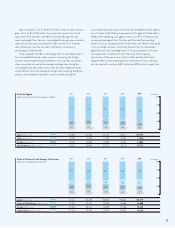
Net sales (Millions of yen)
Operating income (Millions of yen)
Ordinary income (Millions of yen)
Net income (Millions of yen)
Selling, general and administrative expenses/net sales
(%)
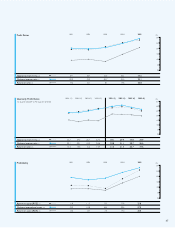
Return on assets (ROA) (%)
Return on equity (ROE) (%)
Equity ratio (%)
Inventory turnover (Months)
Capital expenditures (Millions of yen)
Depreciation, amortization and other (Millions of yen)
Research and development expenses (Billions of yen)
Net income
Cash dividends
Cash flow
Shareholders’ equity
Price earnings ratio (PER) (Times)
Price cash flow ratio (PCFR) (Times)
Price book value ratio (PBR) (Times)
Stock price at year-end (Yen)
Aggregate market value (Billions of yen)
Employees (Persons)
Per share data (Yen)
¥193,402
32,936
35,086
15,300
27.7
7.1
11.4
61.0
3.2
32,318
15,705
6.0
129.70
23.0
267.00
1,220.70
42.7
20.8
4.5
5,540
643.3
9,588
¥167,106
26,229
27,376
11,056
29.6
5.7
9.0
64.3
3.2
19,439
13,018
4.5
93.32
21.0
207.31
1,082.54
39.4
17.8
3.4
3,680
427.3
8,435
¥193,473
26,395
26,759
12,348
28.2
5.3
8.5
63.7
3.4
19,504
17,570
7.5
104.51
28.0
257.64
1,270.68
36.4
14.8
3.0
3,800
441.3
9,320
¥201,290
31,726
33,612
17,837
26.4
7.8
11.6
71.7
3.2
13,654
18,234
7.8
151.10
30.0
310.61
1,362.24
44.5
21.6
4.9
6,720
780.4
9,414
1996 1997 1998 1999