Pentax 2005 Annual Report Download - page 37
Download and view the complete annual report
Please find page 37 of the 2005 Pentax annual report below. You can navigate through the pages in the report by either clicking on the pages listed below, or by using the keyword search tool below to find specific information within the annual report.-
 1
1 -
2
-
3
-
4
-
5
-
6
-
7
-
8
-
9
-
10
-
11
-
12
-
13
-
14
-
15
-
16
-
17
-
18
-
19
-
20
-
21
-
22
-
23
-
24
-
25
-
26
-
 27
27 -
 28
28 -
 29
29 -
 30
30 -
 31
31 -
 32
32 -
 33
33 -
 34
34 -
 35
35 -
 36
36 -
 37
37 -
 38
38 -
 39
39 -
 40
40 -
 41
41 -
 42
42 -
 43
43 -
 44
44 -
 45
45 -
 46
46 -
 47
47 -
48
-
49
-
50
-
51
-
52
-
53
-
54
-
55
-
56
-
57
-
58
-
59
-
60
-
61
-
62
-
63
-
64
-
65
-
66
-
67
-
68
-
69
-
70
-
71
-
72
-
73
-
74
-
75
-
76
-
77
-
78
-
79
 |
 |

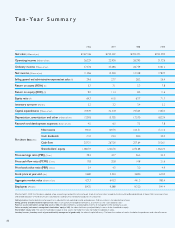
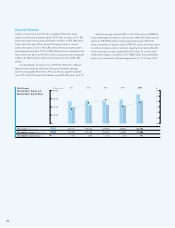
Japan increased 12.2% to ¥166,414 million, while net sales overseas
grew 15.1% to ¥141,758 million. As a result, the composition of net
sales were 54.0% domestic and 46.0% overseas. Although this was
nearly unchanged from the prior consolidated fiscal year, when domestic
sales and overseas sales accounted for 54.6% and 45.4% of total net
sales, respectively, overseas net sales continued to increase as a
percentage of total net sales.
Hoya calculates the effect of exchange rates on operating results in
the consolidated fiscal year under review by comparing the foreign-
currency denominated financial statements of its overseas subsidiaries,
when converted into yen at the average exchange rates during the
consolidated fiscal year under review, with the same statements when
converted into yen at the average exchange rates prevailing during the
previous consolidated fiscal year. In currency markets during the
consolidated fiscal year under review, the yen strengthened 4.6% against
the U.S. dollar to ¥107.60 and appreciated 3.2% against the Thai baht to
¥2.68, while weakening 2.3% against the euro to ¥135.73. Because the
yen appreciated against the U.S. dollar and Thai baht, the operating
results of Group companies in the United States and Thailand decreased
on an exchange rate basis. Conversely, because the yen depreciated
against the euro, the operating results of Group companies in Europe
increased when converted into yen. The result of the ongoing
appreciation of the yen vis-à-vis the U.S. dollar and Thai baht had a
negative effect on the operating results of the entire Group, reducing
net sales and net income by ¥692 million and ¥965 million, respectively.
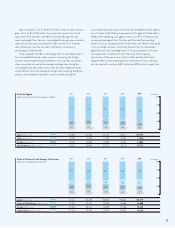
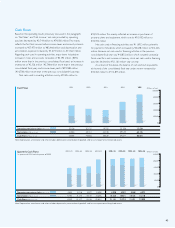
Sales by Region
(Based on the location of the Company’s offices)
(% of total)
100
75
50
25
0
2001 2002 2003 2004 2005
Japan (Millions of yen)
Asia (Millions of yen)
Europe (Millions of yen)
North America (Millions of yen)
168,856
8,792
24,944
34,210
159,368
9,948
28,964
36,985
166,178
11,705
32,639
35,771
188,441
12,404
37,486
33,113
230,946
12,648
33,803
30,775
71.3
3.7
10.5
14.5
67.8
4.2
12.3
15.7
67.5
4.8
13.2
14.5
69.4
4.6
13.8
12.2
74.9
4.1
11.0
10.0
Sales to Domestic and Foreign Customers
(Based on the location of customers)
(% of total)
100
75
50
25
0
2001 2002 2003 2004 2005
Japan (Millions of yen)
Asia and Other Areas (Millions of yen)
Europe (Millions of yen)
North America (Millions of yen)
137,211
27,537
35,870
36,184
132,248
25,127
38,144
39,746
138,006
32,806
38,789
36,692
148,325
44,668
40,168
38,283
166,414
61,808
36,430
43,520
57.9
11.6
15.2
15.3
56.2
10.7
16.2
16.9
56.0
13.3
15.8
14.9
54.6
16.5
14.8
14.1
54.0
20.1
11.8
14.1