Pentax 2005 Annual Report Download - page 44
Download and view the complete annual report
Please find page 44 of the 2005 Pentax annual report below. You can navigate through the pages in the report by either clicking on the pages listed below, or by using the keyword search tool below to find specific information within the annual report.-
 1
1 -
2
-
3
-
4
-
5
-
6
-
7
-
8
-
9
-
10
-
11
-
12
-
13
-
14
-
15
-
16
-
17
-
18
-
19
-
20
-
21
-
22
-
23
-
24
-
25
-
26
-
27
-
28
-
29
-
30
-
31
-
32
-
33
-
 34
34 -
 35
35 -
 36
36 -
 37
37 -
 38
38 -
 39
39 -
 40
40 -
 41
41 -
 42
42 -
 43
43 -
 44
44 -
 45
45 -
 46
46 -
 47
47 -
 48
48 -
 49
49 -
 50
50 -
 51
51 -
 52
52 -
 53
53 -
 54
54 -
55
-
56
-
57
-
58
-
59
-
60
-
61
-
62
-
63
-
64
-
65
-
66
-
67
-
68
-
69
-
70
-
71
-
72
-
73
-
74
-
75
-
76
-
77
-
78
-
79
 |
 |
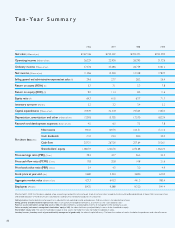
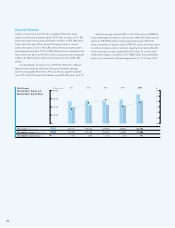
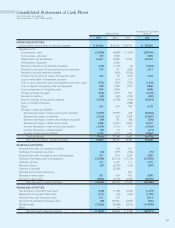
Financial Position
In terms of assets at the end of the consolidated fiscal year under
review, cash and cash equivalents grew 40.3% year on year to ¥112,875
million, and notes and accounts receivable rose 8.2% to ¥75,296 million.
These were the major factors behind the large increase in current
assets, which grew 20.5% to ¥232,872 million. Because property, plant
and equipment increased 21.5% to ¥95,158 million and investments and
other assets rose 28.2% to ¥23,452 million, noncurrent assets expanded
22.8% to ¥118,610 million. Total assets increased 21.2%, to ¥351,482
million.
Current liabilities increased 3.7% to ¥70,792 million. This reflected
higher accrued expenses and notes and accounts payable, although
income taxes payable fell 30.4% to ¥10,023 million. Long-term liabilities
rose 1.9% to ¥1,970 million. Total liabilities were ¥72,762 million, up 3.7%.
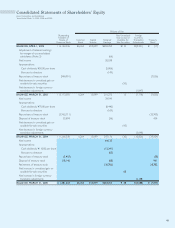
Retained earnings increased 8.5%, or ¥21,079 million, to ¥268,255
million, reflecting the increase in net income of ¥64,135 million and the
decrease of ¥43,056 million comprising dividends paid of ¥12,241
million, retirement of treasury stock of ¥30,702 million, and other items.
In addition, foreign currency translation adjustments shrank by ¥6,138
million, and treasury stock declined ¥31,625 million. As a result, total
shareholders’ equity rose 26.9% to ¥277,889 million. The shareholders’
equity ratio increased by 3.6 percentage points, to 79.1%, from 75.5%.
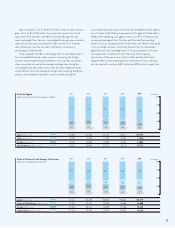
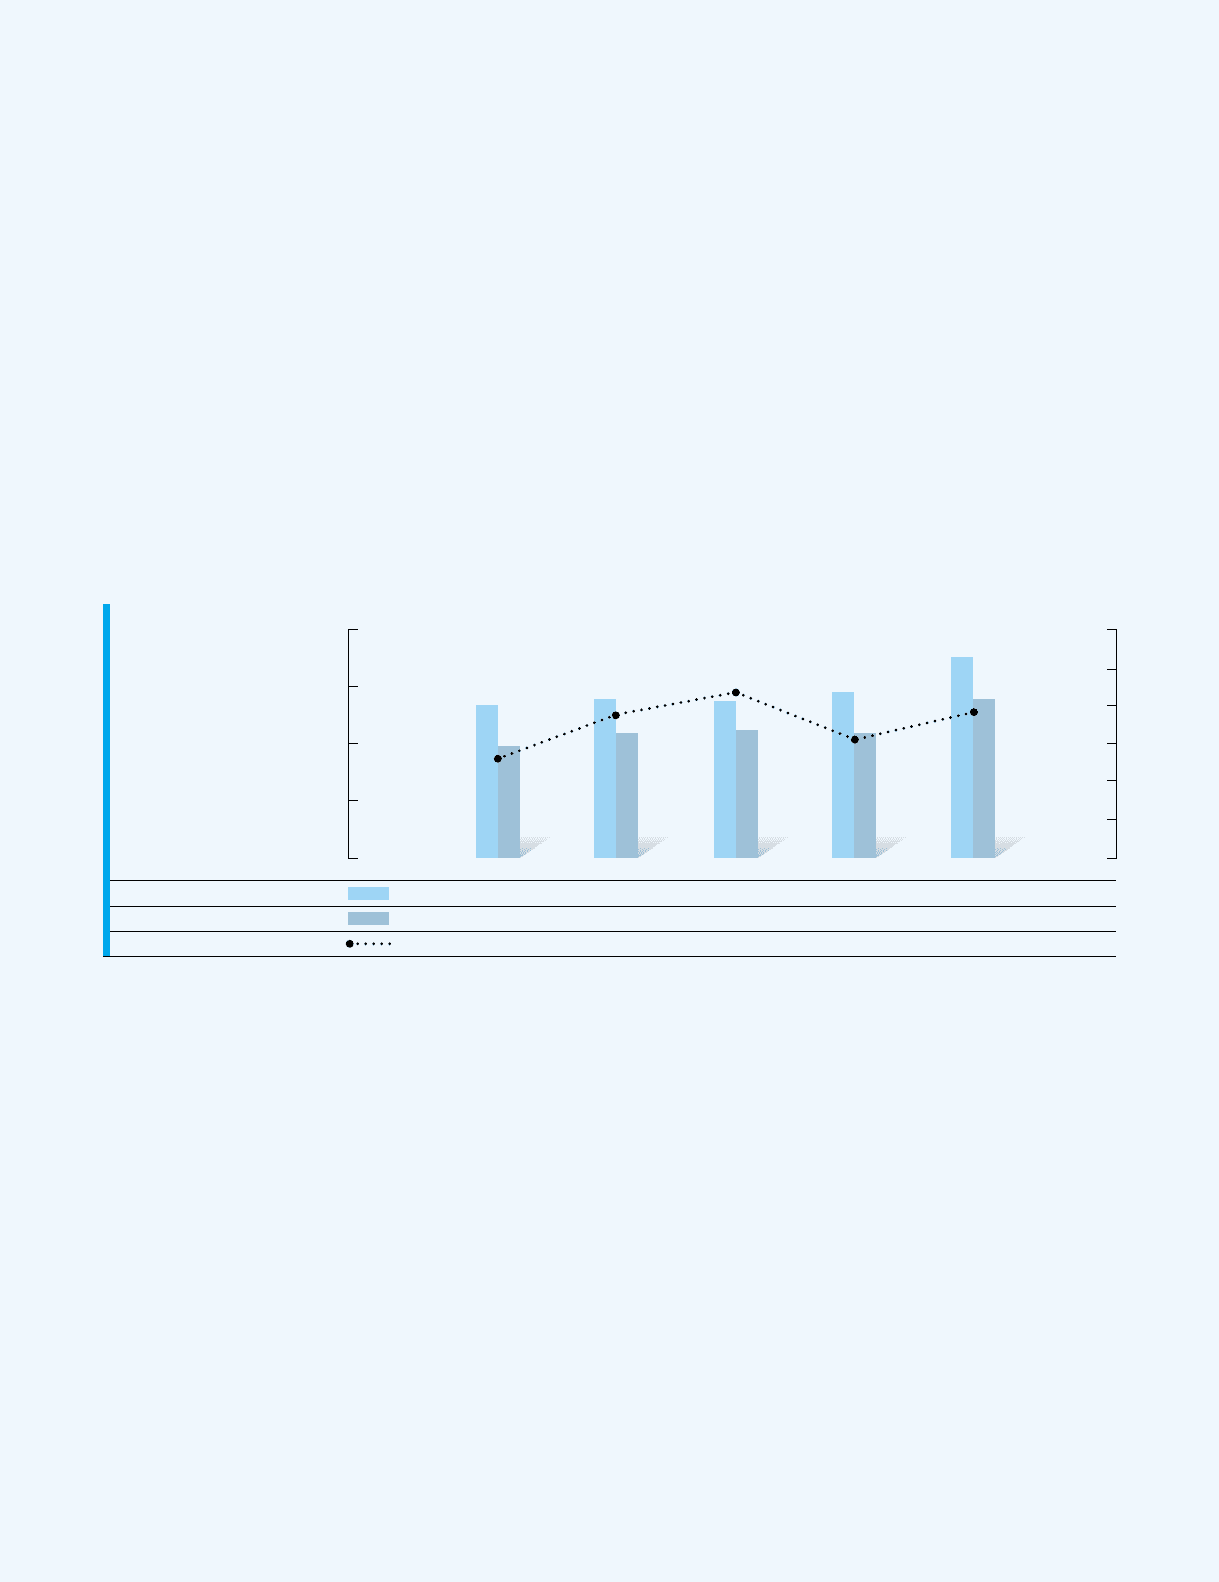
Total Assets,
Shareholders’ Equity and
Shareholders’ Equity Ratio
(Millions of yen)
400,000
300,000
200,000
100,000
0
(%)
90
85
80
75
70
65
60
2001 2002 2003 2004 2005
Total assets (Millions of yen)
Shareholders’ equity (Millions of yen)
Shareholders’ equity ratio (%)
267,611
195,333
73.0
278,068
219,180
78.8
274,289
224,219
81.7
289,887
218,979
75.5
351,482
277,889
79.1